Ripple XRP Price Analysis Dec.29 & Overview: A Correction or Bears are Back in Action?


Is the market still in a correction mode after the last short-lived rally that made everybody feel good again? Or did the 10% move we noticed yesterday was a verification that the market is still looking for higher highs?
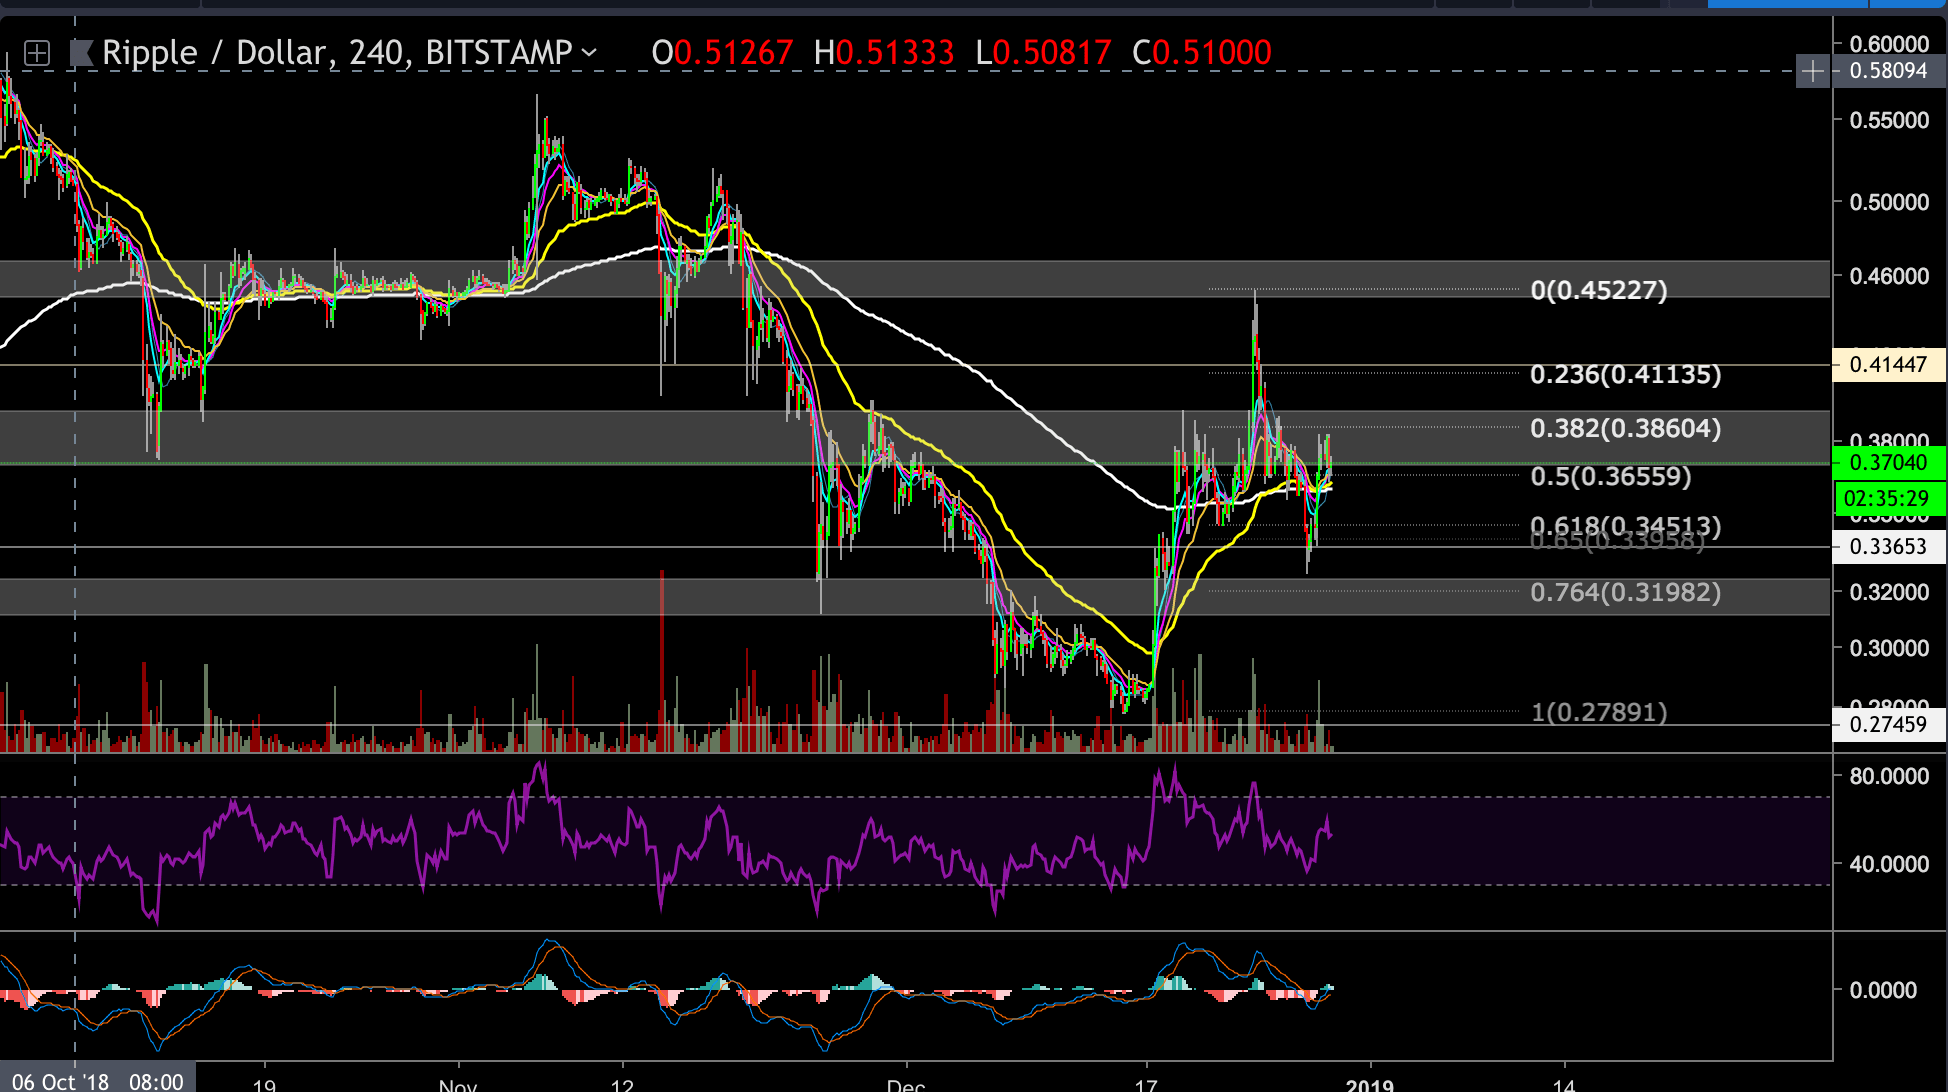
XRP is currently trading at the $0.37 price level. It is down 18% since the last peak of $0.448 where XRP spiked with a long candle and got rejected by the 200 EMA (4 hours chart) and created a very long wick on this specific candle top.
Looking at the BitStamp 4 hours chart
- XRP had a bounce exactly at 0.618 Fibonacci retracement level of the last high, which is just above the $0.324 support level.
- As we expected we got some bulls reaction at those levels; the 0.618 is a very sweet price point where bulls usually look to re-enter their longs.
- Please notice that the 200 and 55 EMA’s had a golden cross and then immediately crossed back and the two lines are currently flirting with each other.
- At the moment everything lays in the hands of BTC. if BTC continues climbing then XRP and the other Alts will probably act the same, but on the other side, if BTC price retest the support and breaks the 0.618 and 0.764 FIb levels then we might be seeing the crypto market testing the lows again, but at the moment the bulls are in favor
- Next bull targets can be found at he the $0.45 resistance area while next bearish target could be found back at the 40.324 support level.
Looking at the BitStamp XRP/BTC 4 hours chart
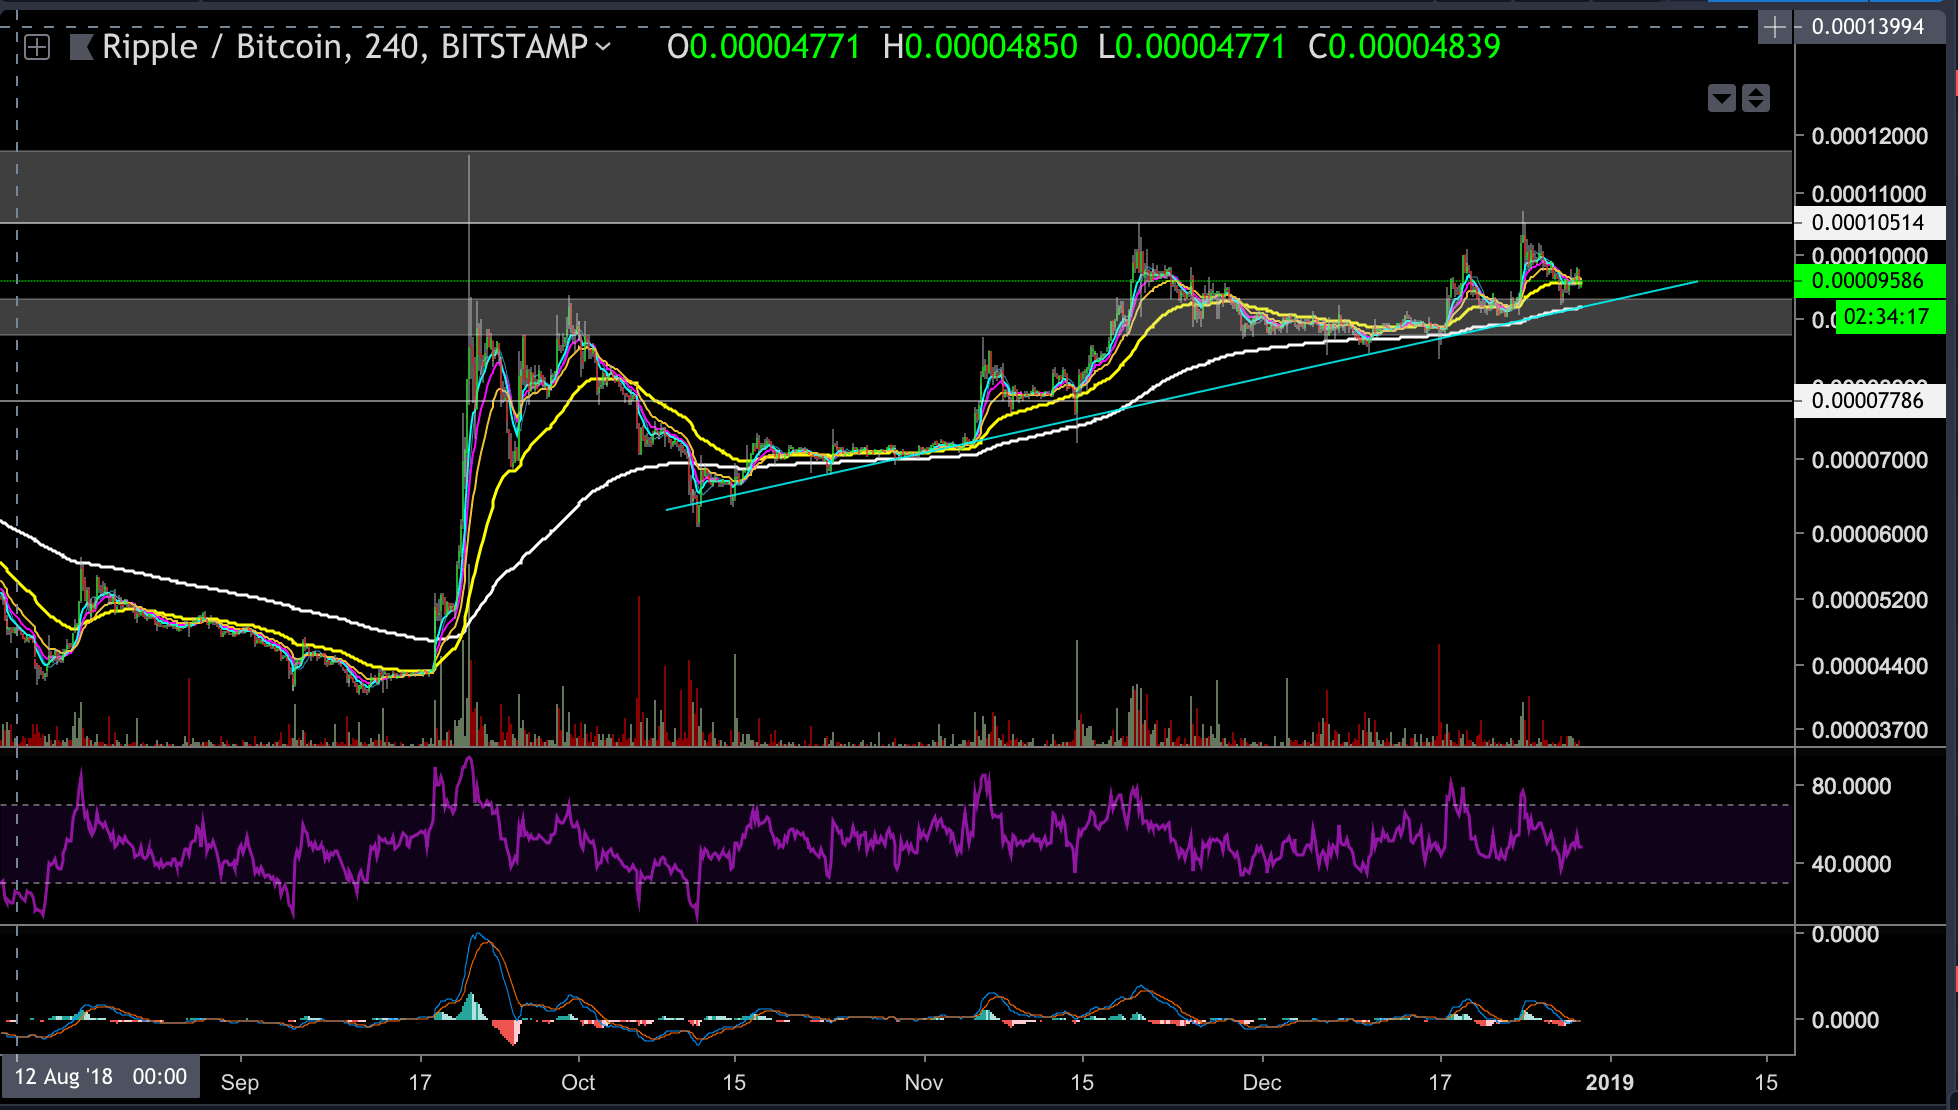
- XRP is currently trading just above the 0.000093-0.000087BTC support level.
- You can notice on the attached chart the blue trend line that supported the XRP chart since October the 11th, and its current interaction point is precisely in the mid part of the gray support area.
- There is a nice ascending diagonal formation starting to develop on a high time frame. These type of formations are usually a bearish sign, but at the moment it is too early to evaluate this formation as it has to mature more before it can be trusted. In many cases, those formations can act as a continuation pattern as well.
- In case the mentioned support level get breached then the next support level can be found at the 0.00007814BTC price level. But on the other hand, if XRP gets another leg inside the developing diagonal formation, then the next target could be located on the upper trend line of the formation at 0.000105BTC which is the future price resistance level as well.
The post Ripple XRP Price Analysis Dec.29 & Overview: A Correction or Bears are Back in Action? appeared first on CryptoPotato.