Ripple XRP Price Analysis Dec.24: Following 50% Weekly Increase, What’s Coming Up?


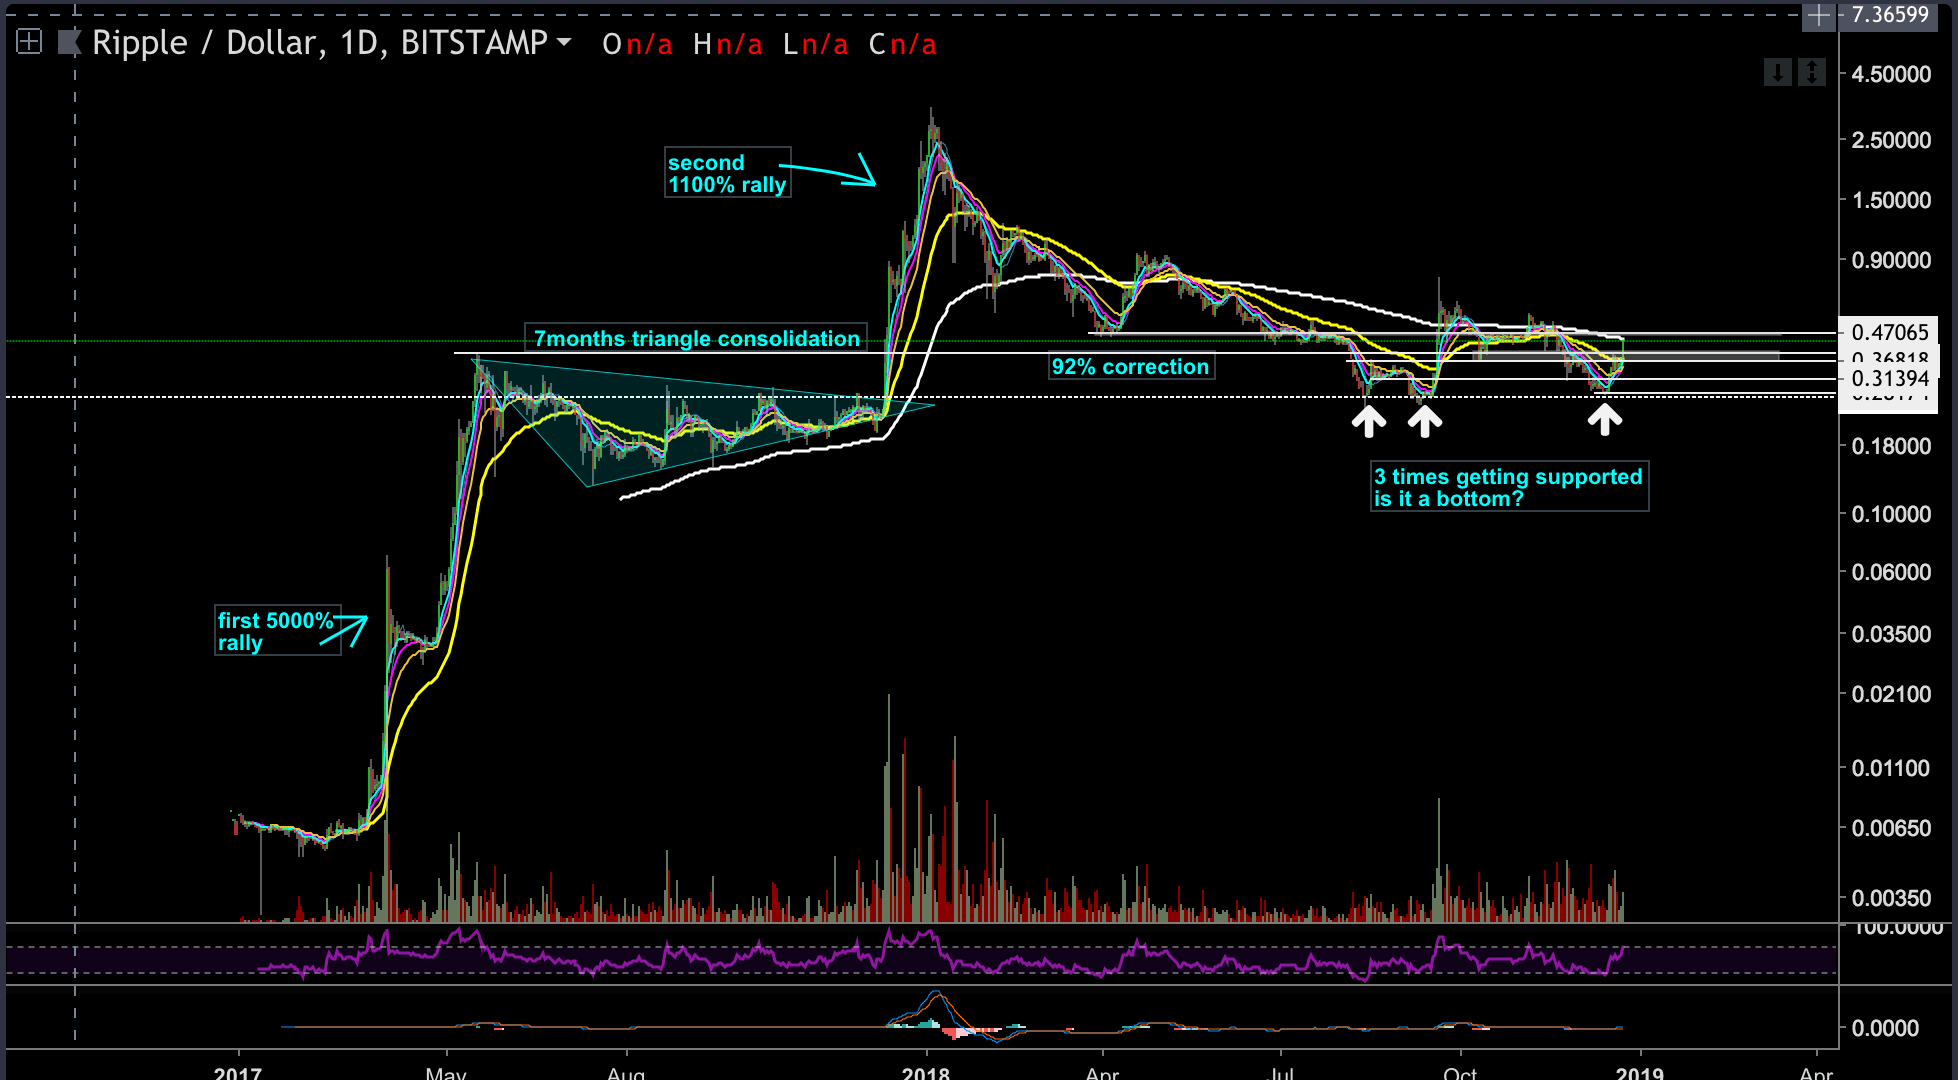
Before we dive into the current XRP status and analysis, let’s start with a wider time-frame review (looking at the following daily XRP-USD chart):
XRP had two significant rallies in its short history: The first XRP rally began in March 2017 and lasted for two months. That move had granted XRP’s investors more than 5000%, an unbelievable yield. Every $1000 that was invested would have turned into $50,000. XRP’s price went from $0.006 up to $0.37.
From that point until December 2017, XRP consolidated in what seems like a near perfectly triangle formation. It took around seven months for the triangle to develop: from the formation’s inception until the apex.
The breakout of the triangle had triggered the second XRP rally, from $0.27 to the all-time high at $3.3. 1100% yield.
Since the peak reached on January 2018, XRP lost 92% of its value in a five wave’s decline that took over 11 months.
What is interesting is the fact that XRP corrected precisely to the $0.27 price level, which was the trigger price of the last triangle formation that initiated XRP’s recent rally. Well, this is not a coincidence. Those are the technical rules of markets, or how “market makers” play the game.
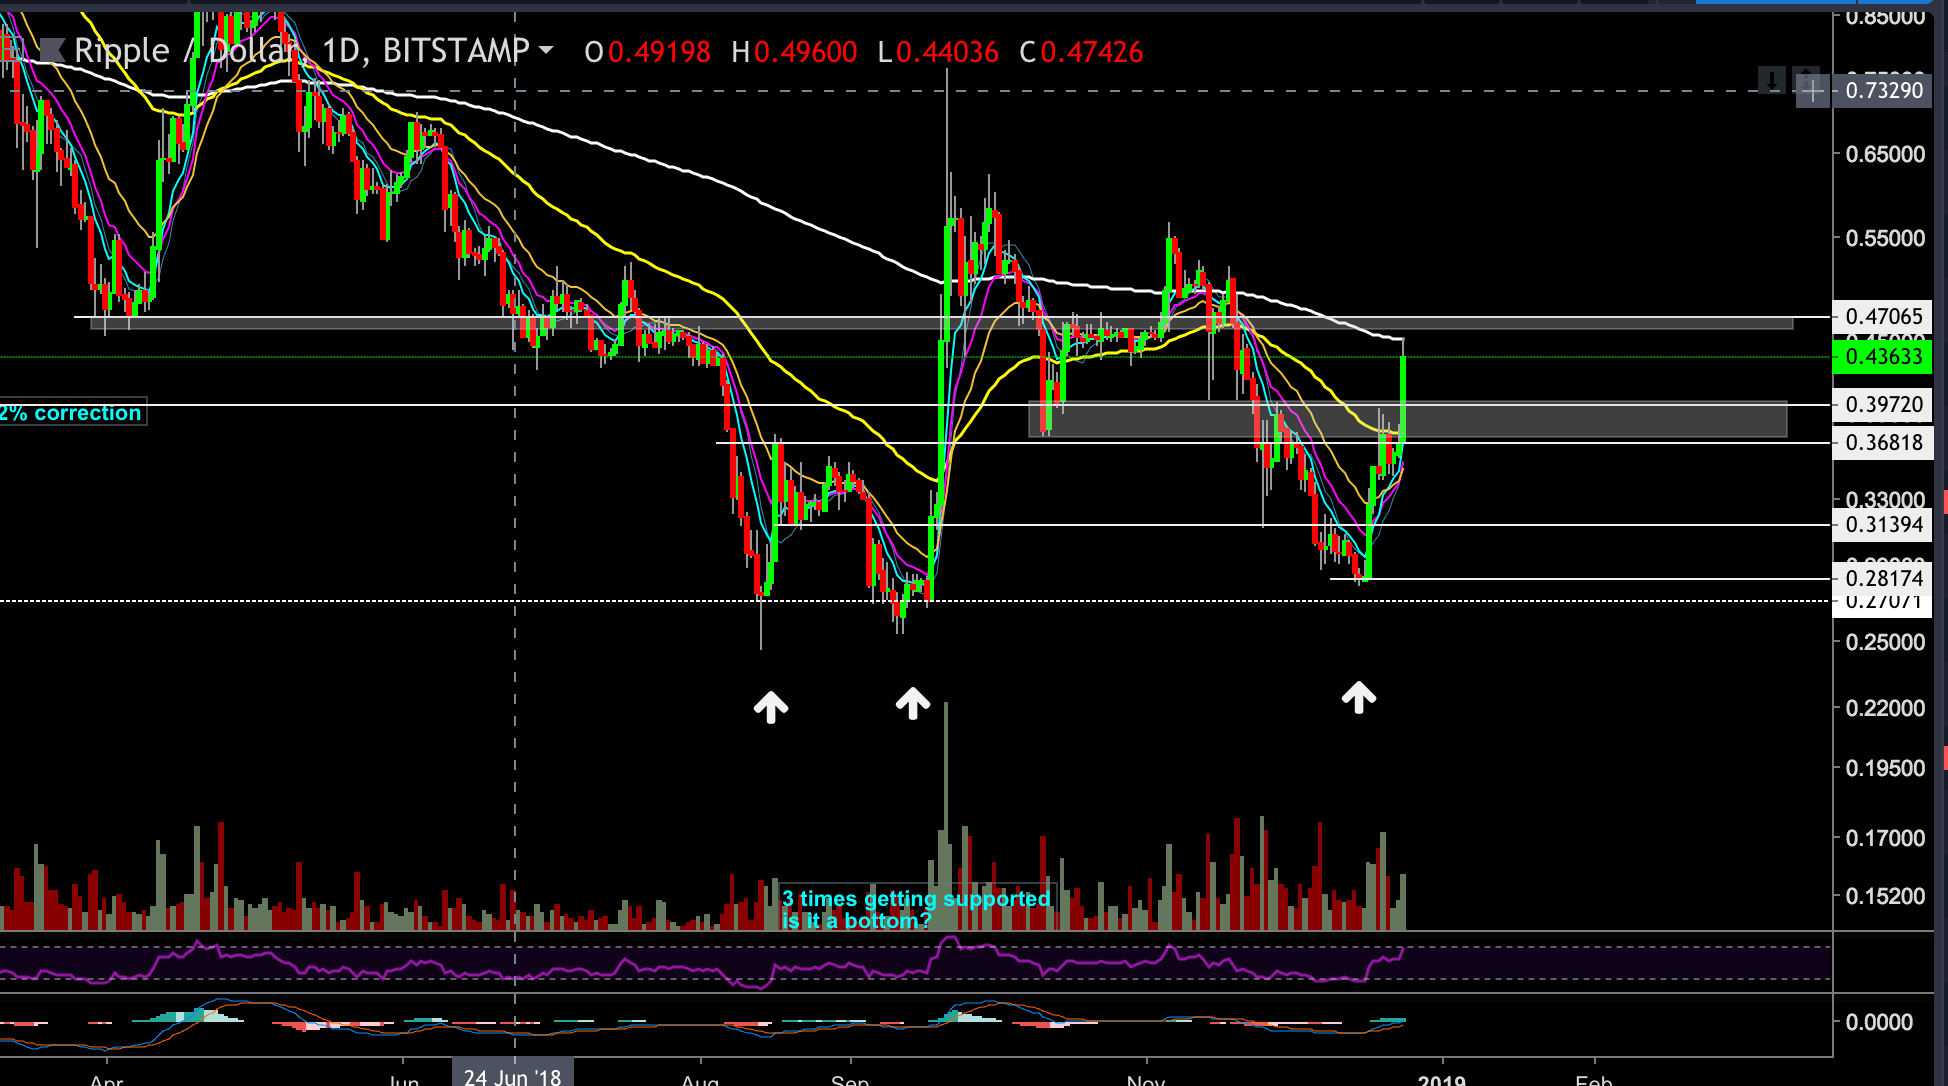
XRP had touched the $0.27 price level three times since August 2018, in what seems to be a solid floor.
It is fascinating to notice that even after a 92% loss, XRP is still trading above the first rally’s price level and the 5000% move.
So what’s next for Ripple XRP?
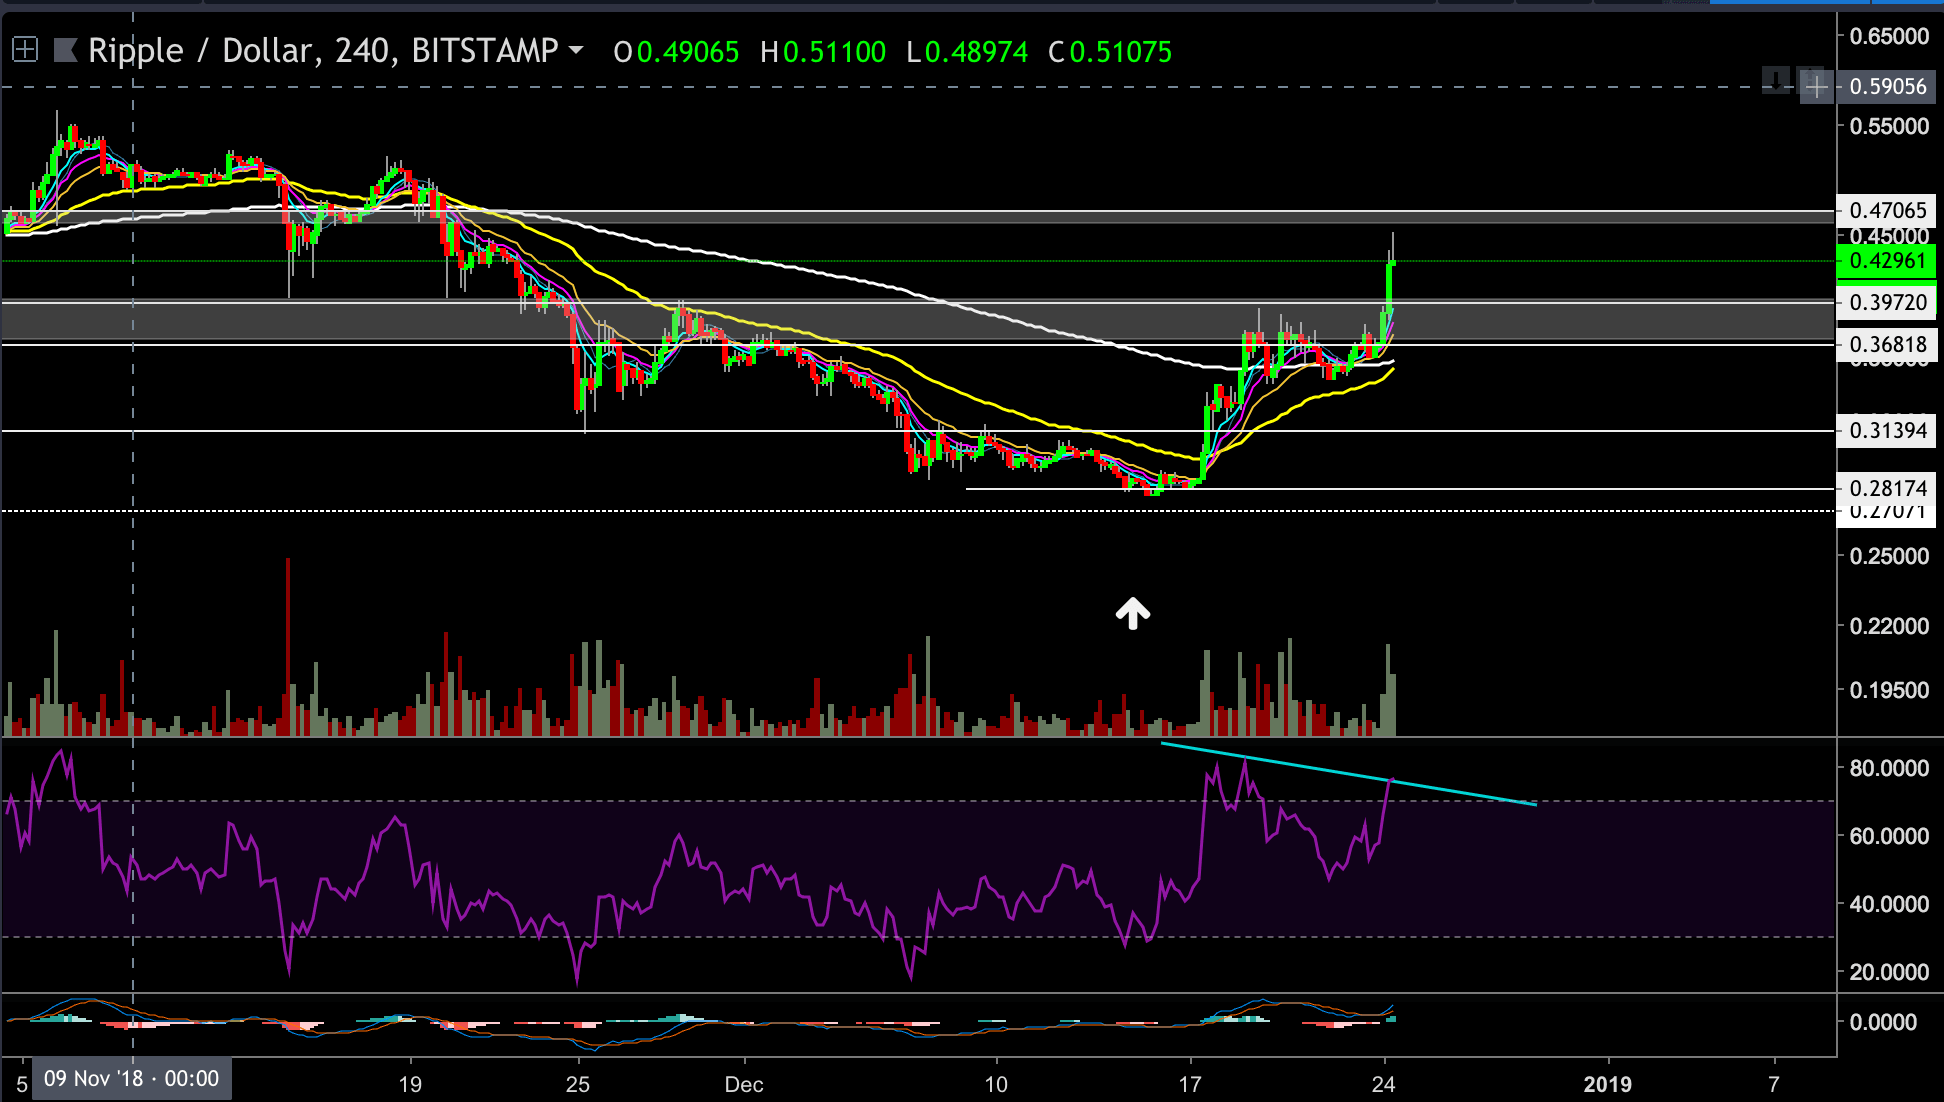
- XRP is currently trading 55% above the mentioned support level, and from a closer look (4-hour chart) we can see that for the third time, the $0.27 support level held.
- Another thing worth mentioning is that XRP chart didn’t create a higher high, yet, since the third time it touched the $0.27 support level.
- In the last 12 hours, XRP broke above the $0.37- $0.395 price level, which is the resistance level that was created by the top of the first-mentioned XRP rally on the 18th of May 2017. The next target for XRP could be found around the $0.45-$0.47 resistance level.
- However, we can assume that it wouldn’t be easy for XRP to break-up the $0.47 resistance level on the first try. As of now, XRP is facing the resistance of the 200 EMA on the daily chart.
- XRP could consolidate sideways in order to gain momentum for a second breakout attempt, or it could retest the $0.395 resistance-turned support
In a more bearish scenario, lower support lies on the mid-channel support level at $0.3139. If XRP breaks below that level,, then XRP will probably try to test the $0.27 support level one more time, but it is too early to determine that. - Looking at the 4-hour chart: After a nice bullish move, XRP lies in the mid-channel between the $0.45-$0.47 resistance, and the $0.395-$0.37 support level. A breakout to any side will determine the short-term of XRP.
- The 4-hour RSI is around the overbought zone with negative diversions signal starting to develop (higher highs on price while lower highs on RSI).
XRP/USD BitStamp 4-Hour chart
XRP/USD BitStamp 1-Day chart
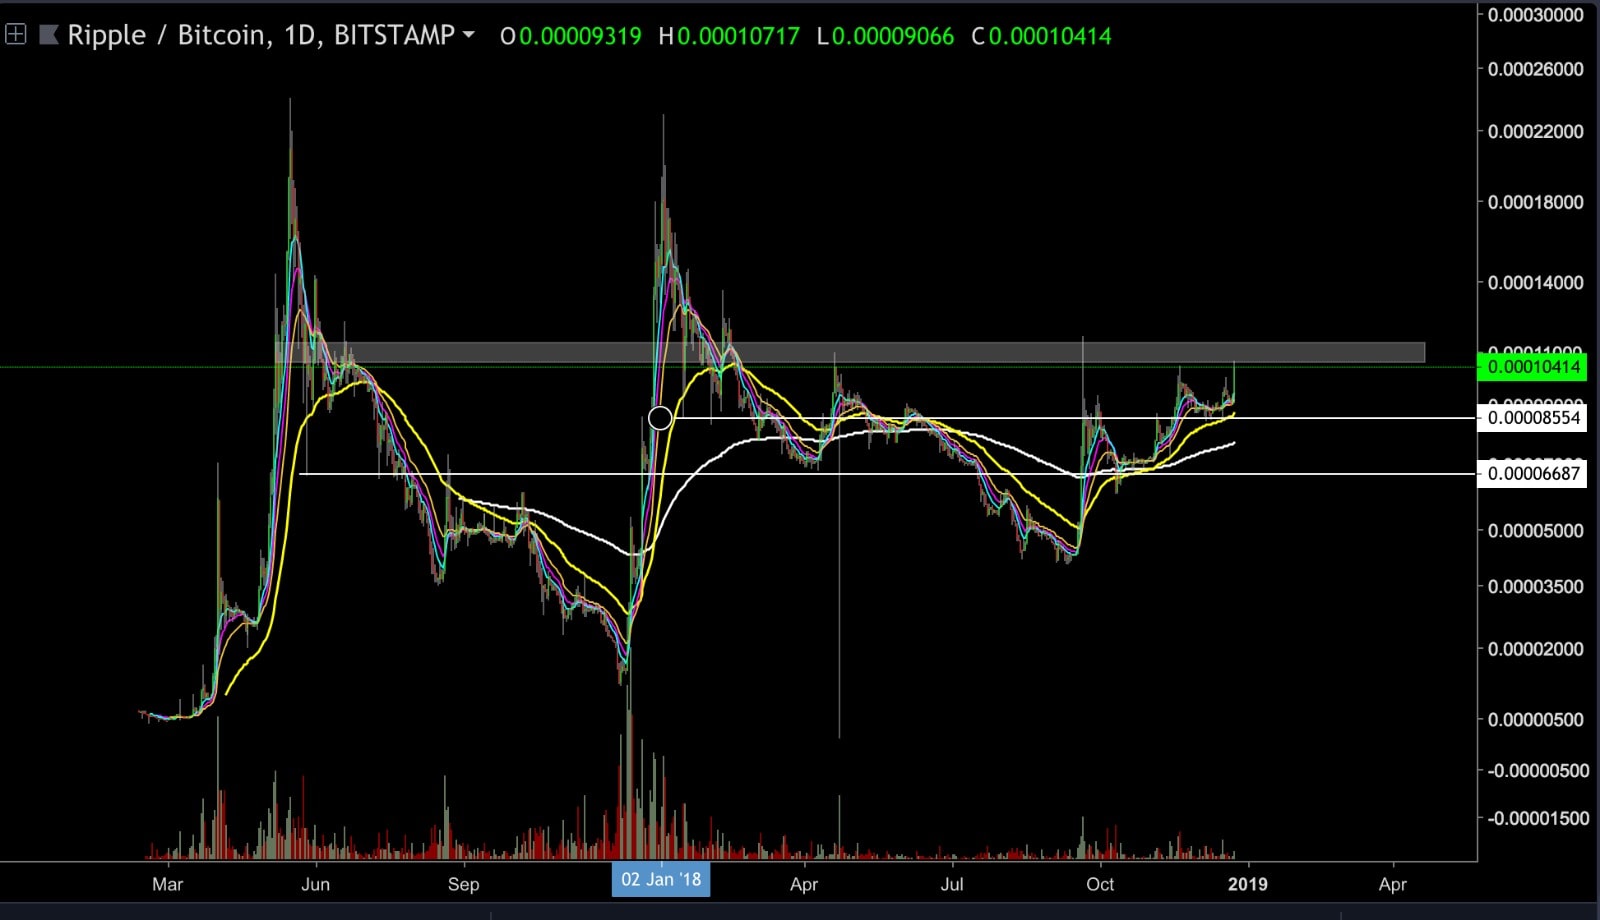
XRP/BTC BitStamp 1-Day chart
Looking at the 1-day XRP-BTC chart, we can see that XRP is approaching the 0.0001-0.000115 BTC resistance area for the fourth time.
It recently spiked above this resistance level on the 19th of Sep.2018, and turn immediately back down. Since then, XRP tried a few more times to approach the significant resistance level, while creating higher lows in between.
This is the most critical price level against Bitcoin at the moment while taking into consideration that from the bear side, the closest significant support level lies at the 0.0000855 BTC level, before the 0.000067 floor.
The post Ripple XRP Price Analysis Dec.24: Following 50% Weekly Increase, What’s Coming Up? appeared first on CryptoPotato.