Ethereum Price Analysis Dec.23: ETH Gains 30% In 2 Days. What’s Next?


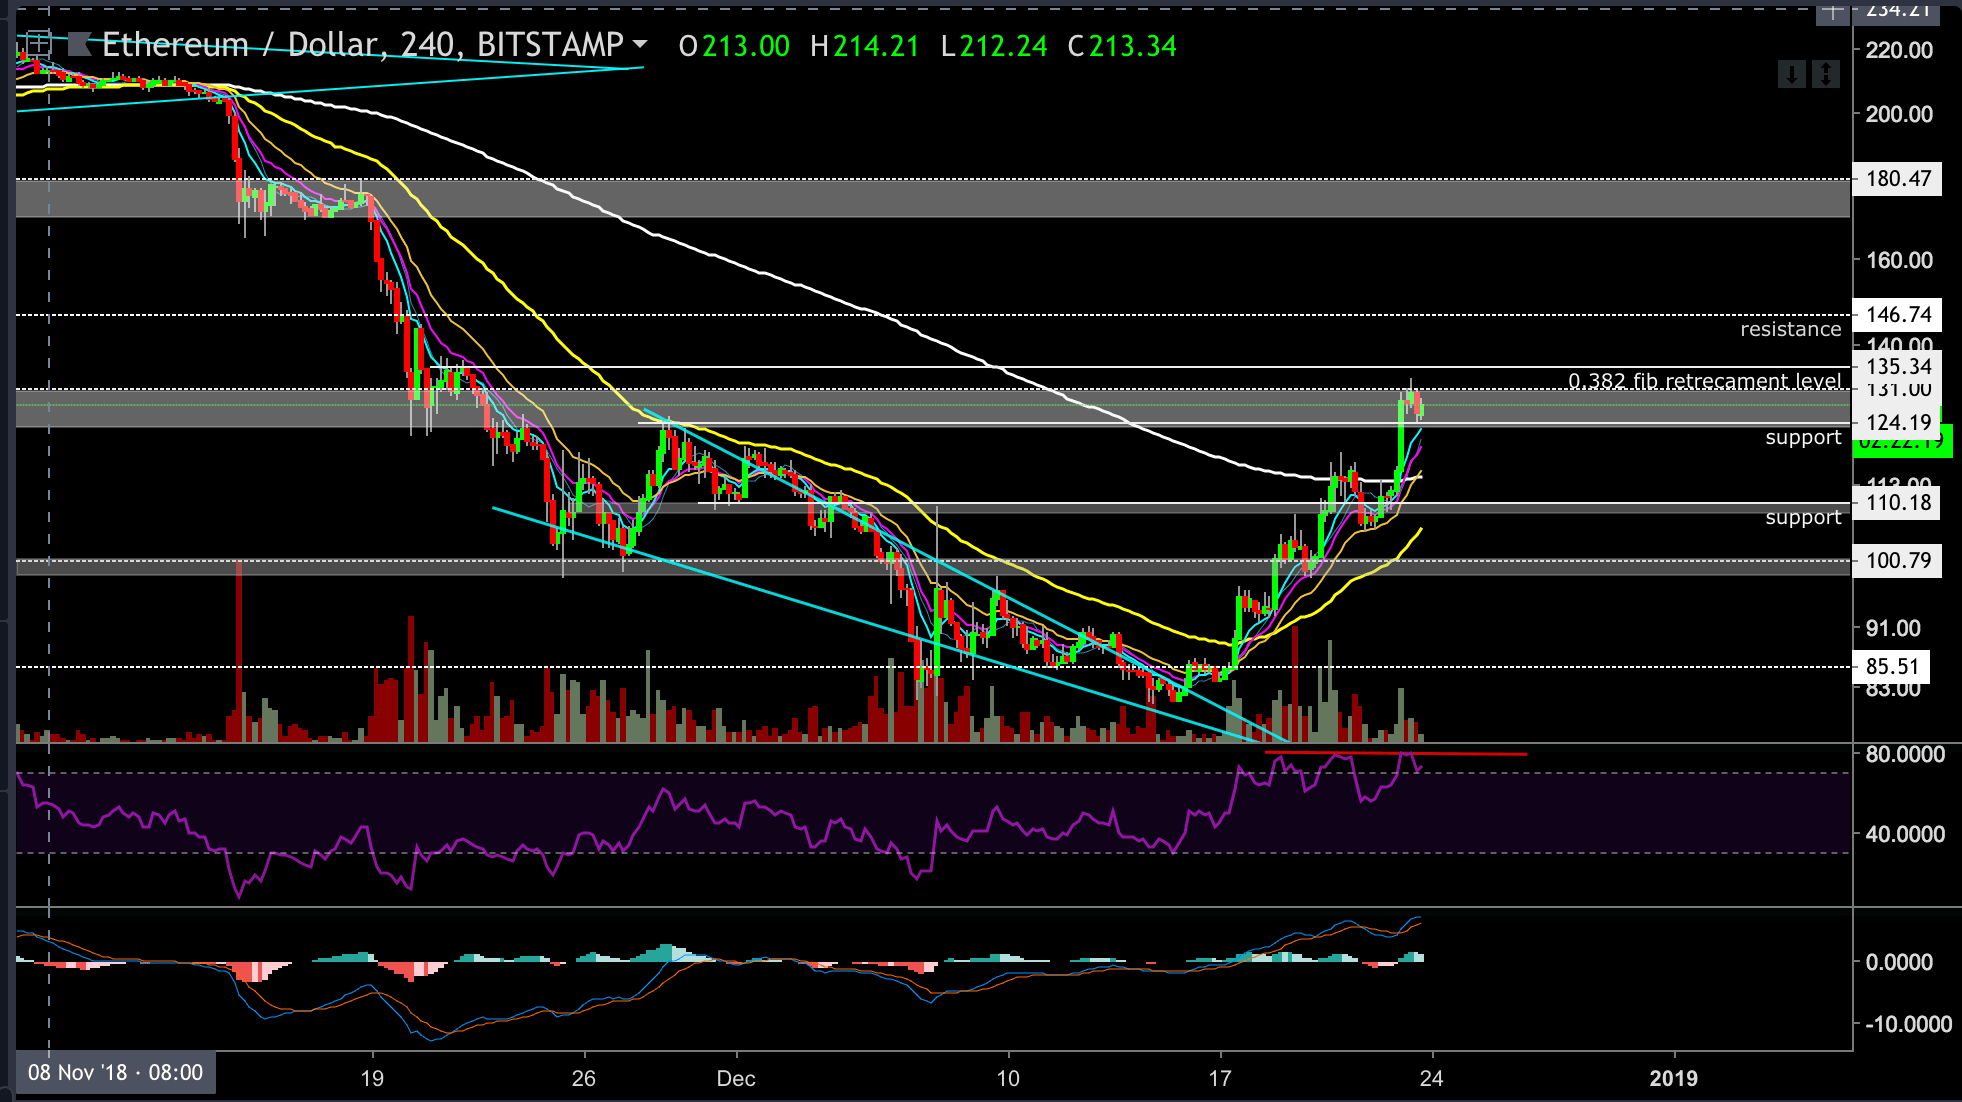
Since our last analysis, ETH price managed to climb above the 200-EMA (on the following 4-hour chart) and perfectly reached our target at the $124-$130 area. More than that, it almost reached the 0.382 Fib retracement level, which was our next target at $135.
During the last 24 hours, ETH was leading the crypto markets. The price had created a higher high, while Bitcoin’s chart couldn’t find the momentum needed for another higher leg.
At the moment of writing this post, BTC and ETH are moving sideways (1-hour chart) in what seems like a triangle consolidation pattern, or even more complex WXYXZ type of correction
(WXYXZ is a complicated Elliot Wave theory-based type of consolidation).
BTC is currently locked between the $3900 support level and the $4300 resistance level while ETH chart is fighting against the $130 resistance level.
We had a nice mini-rally during the past week, but this movement is slowly losing its momentum, and a correction down is maybe behind the corner.
Looking at the 4-hour ETH-USD chart
- ETH had a very nice run and is currently trading at the $128 price level, which is in the marked resistance area (the gray area on chart).
- As we know, prior resistance turns into support, hence ETH closest support level is the resistance-turned support of $123.5. ETH will probably correct towards the above level, and could even go lower towards the next support level at $111.
- Elliot Wave theory suggests that the uptrend has five full impulse waves, which means that ETH is ready for a correction. But with that said, ETH is still trading above all EMA’s, which is a bullish sign.
- The RSI-indicator is still in the overbought regions and couldn’t find the momentum to create new highs, while the price did create higher highs. This is a bearish signal; negative diversions, so traders should watch out.
- On the other hand, if the bulls manage to keep the current uptrend live for another leg up, then our estimated target could be the $135 (0.382 Fib retracement level) or even higher target at the $145 price level, which is the next 1-day chart’s
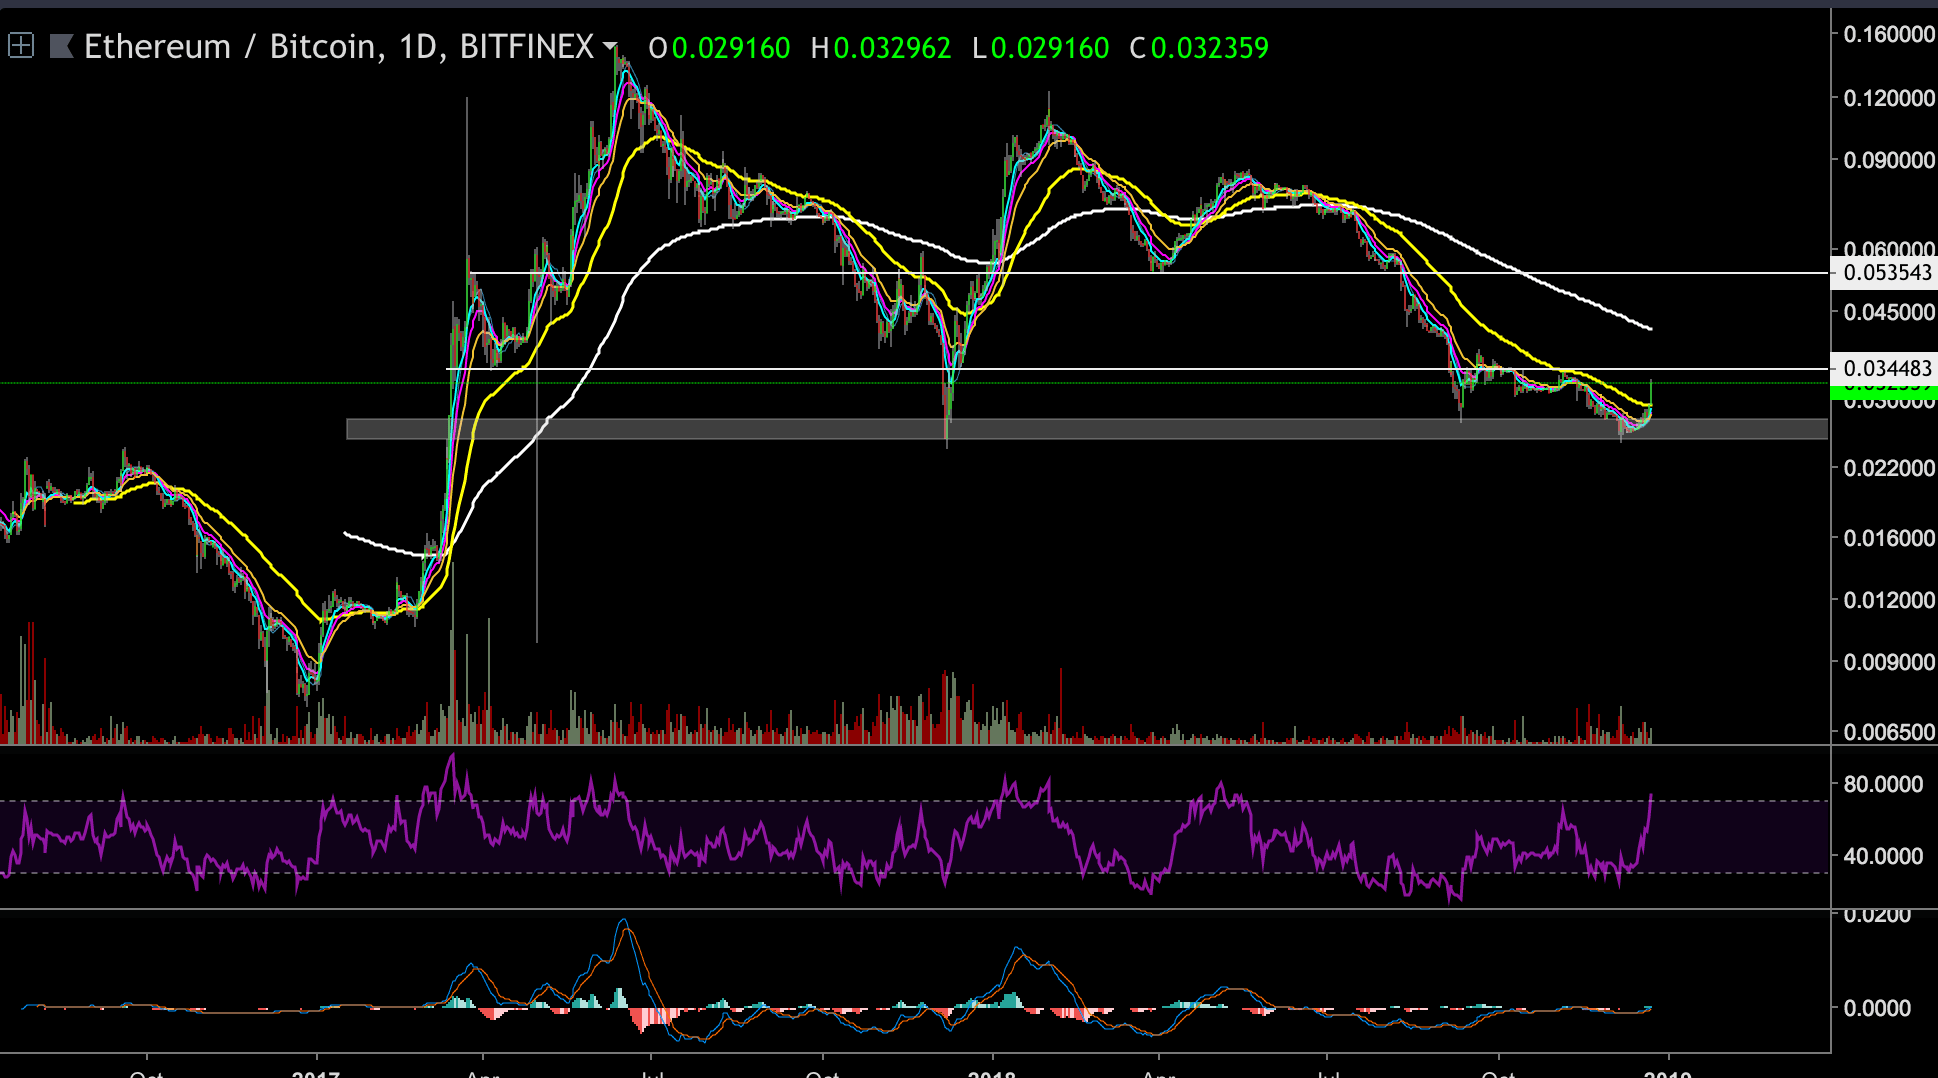
Looking at the 1-day ETH-BTC chart
We can notice that ETH found a temporary bottom floor at the 0.0247 BTC support level, and since then turned upwards very sharply.
The next resistance lies at the 0.0342BTC level. In case ETH reaches there, it won’t be easy to break up.
The RSI indicator is reaching the overbought regions.
ETH/USD BitStamp 4-Hour Chart
ETH/BTC BitStamp 1-Day Chart
The post Ethereum Price Analysis Dec.23: ETH Gains 30% In 2 Days. What’s Next? appeared first on CryptoPotato.