Ethereum Price Analysis Dec.16: Positive Diversions, Is Reversal Ahead?


After a bearish couple of days, where Bitcoin had discovered a new yearly low, BTC is currently attempting to breach the channel’s upper trend line.
A breakout could lead to a temporary upward continuation, but, since my Elliott wave count suggests that the downtrend isn’t over yet, I am playing it safe. There is another leg down for the wave 5 of 5 of C if my waves count is correct.
With that said, looking at the daily chart, we can notice a new lower low while the RSI indicator creates a higher low. This situation is called positive diversions, and it usually suggests that the bearish momentum is slowly fading away, while a move up is expected.
RSI is a useful tool, however like all other technical indicators; it should be taken with a grain of salt. Price action and trading volume are always the best parameters to look at).
Most of the major Altcions are following Bitcoin at the moment, and we can notice a descending diagonal being developed in many charts. This diagonal could take more time to develop, as a higher degree of trend, or, could be almost complete; we will have to wait and see.
A descending diagonal is usually a sign for a weakening of the sellers and most likely leads to an upward breakout soon as its upper trend breaks.
The upcoming week could play an essential role in the market’s mid-term direction.
Ethereum had retested the $80 regions in the last 48 hours. It barely created a new low and went back up to test the upper trend line.
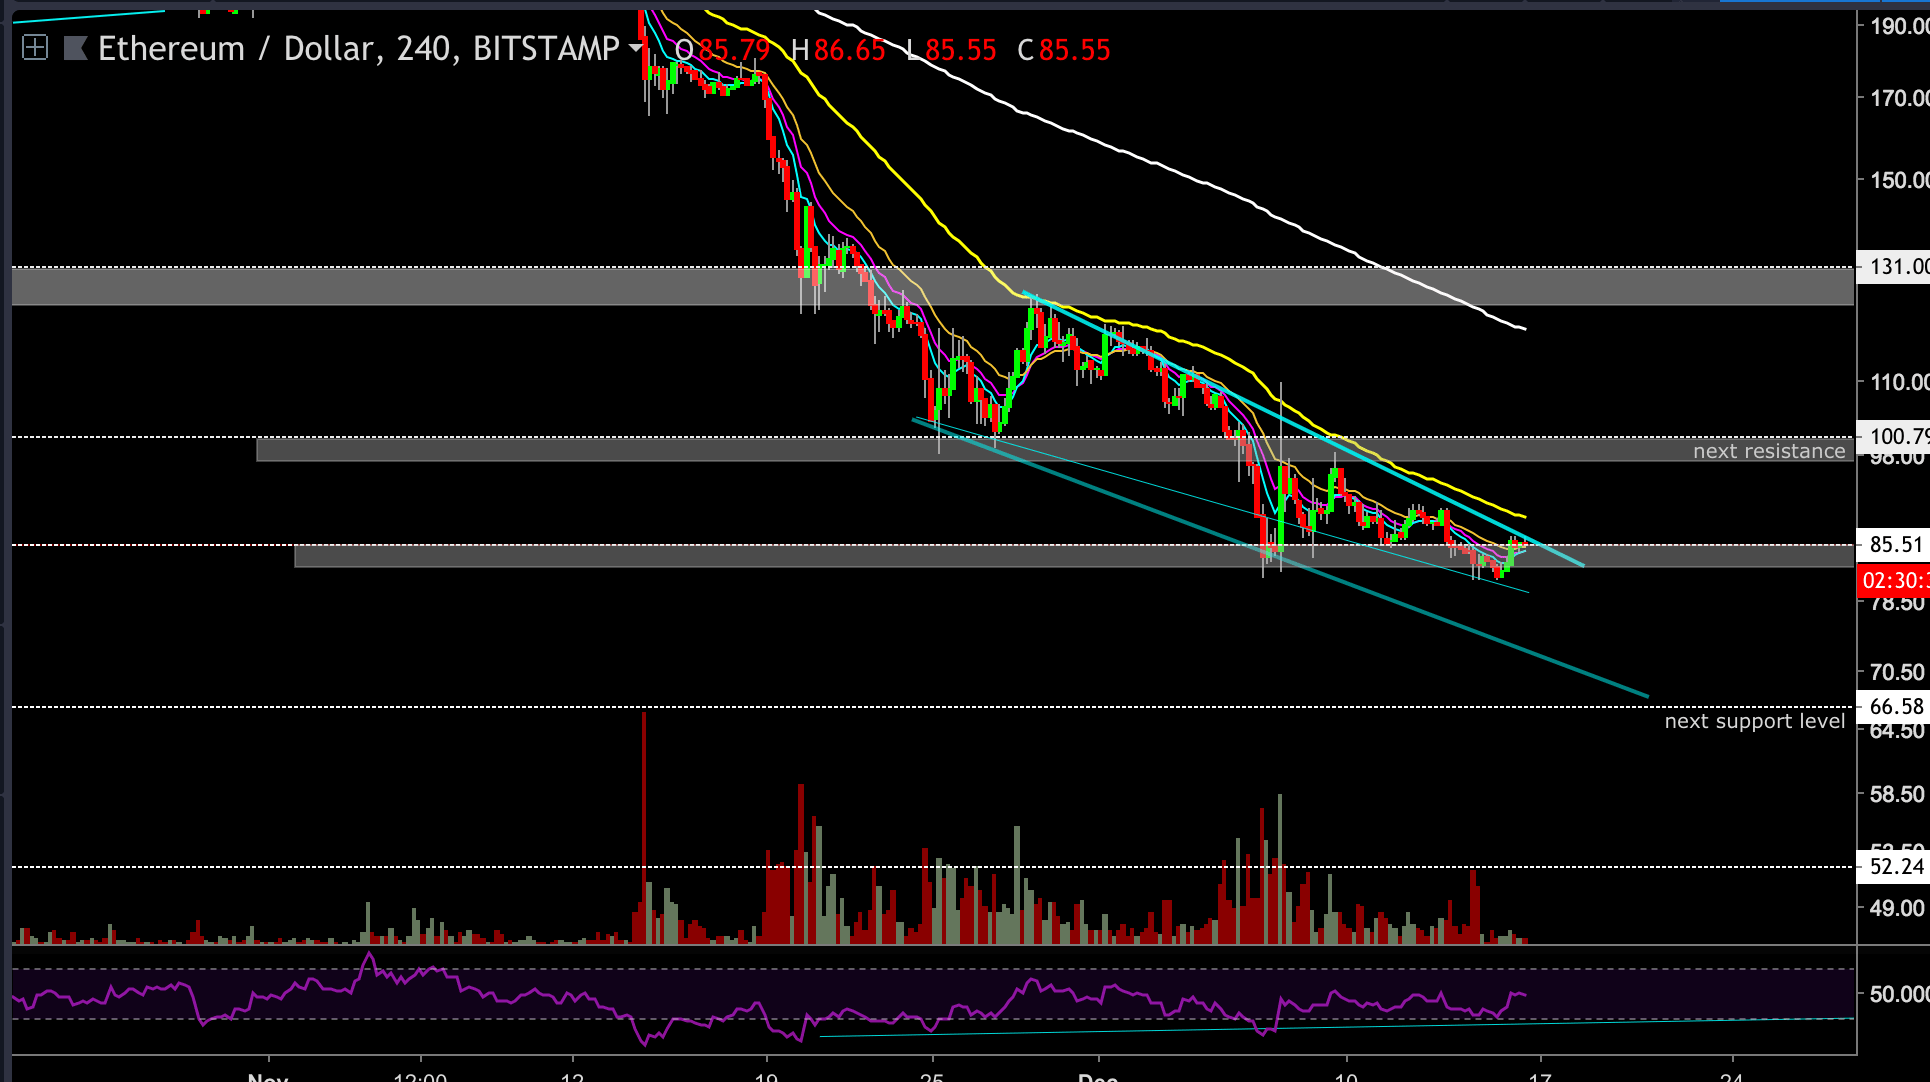
Looking at the ETH 4-hour chart
- ETH is currently trading around the $85 price level and is testing the channel’s upper trend-line, following Bitcoin’s chart.
- If this line gets breached, the next target could be found at the $97 – $100 price level, which is also the next resistance level. However, if this breach turns out to be a fake (bull trap), it could be quickly rejected by the 55-EMA, currently located around the $90 price level.
- There is not enough volume at the moment to support the mentioned breakout, so in case that the trend-line’s resistance force rejects ETH and price turns back down, then ETH will most likely test the $81 level again, and a possible break below it towards the next support located at the $69 price level.
- 4-hour’s chart RSI is currently testing the 50 level.
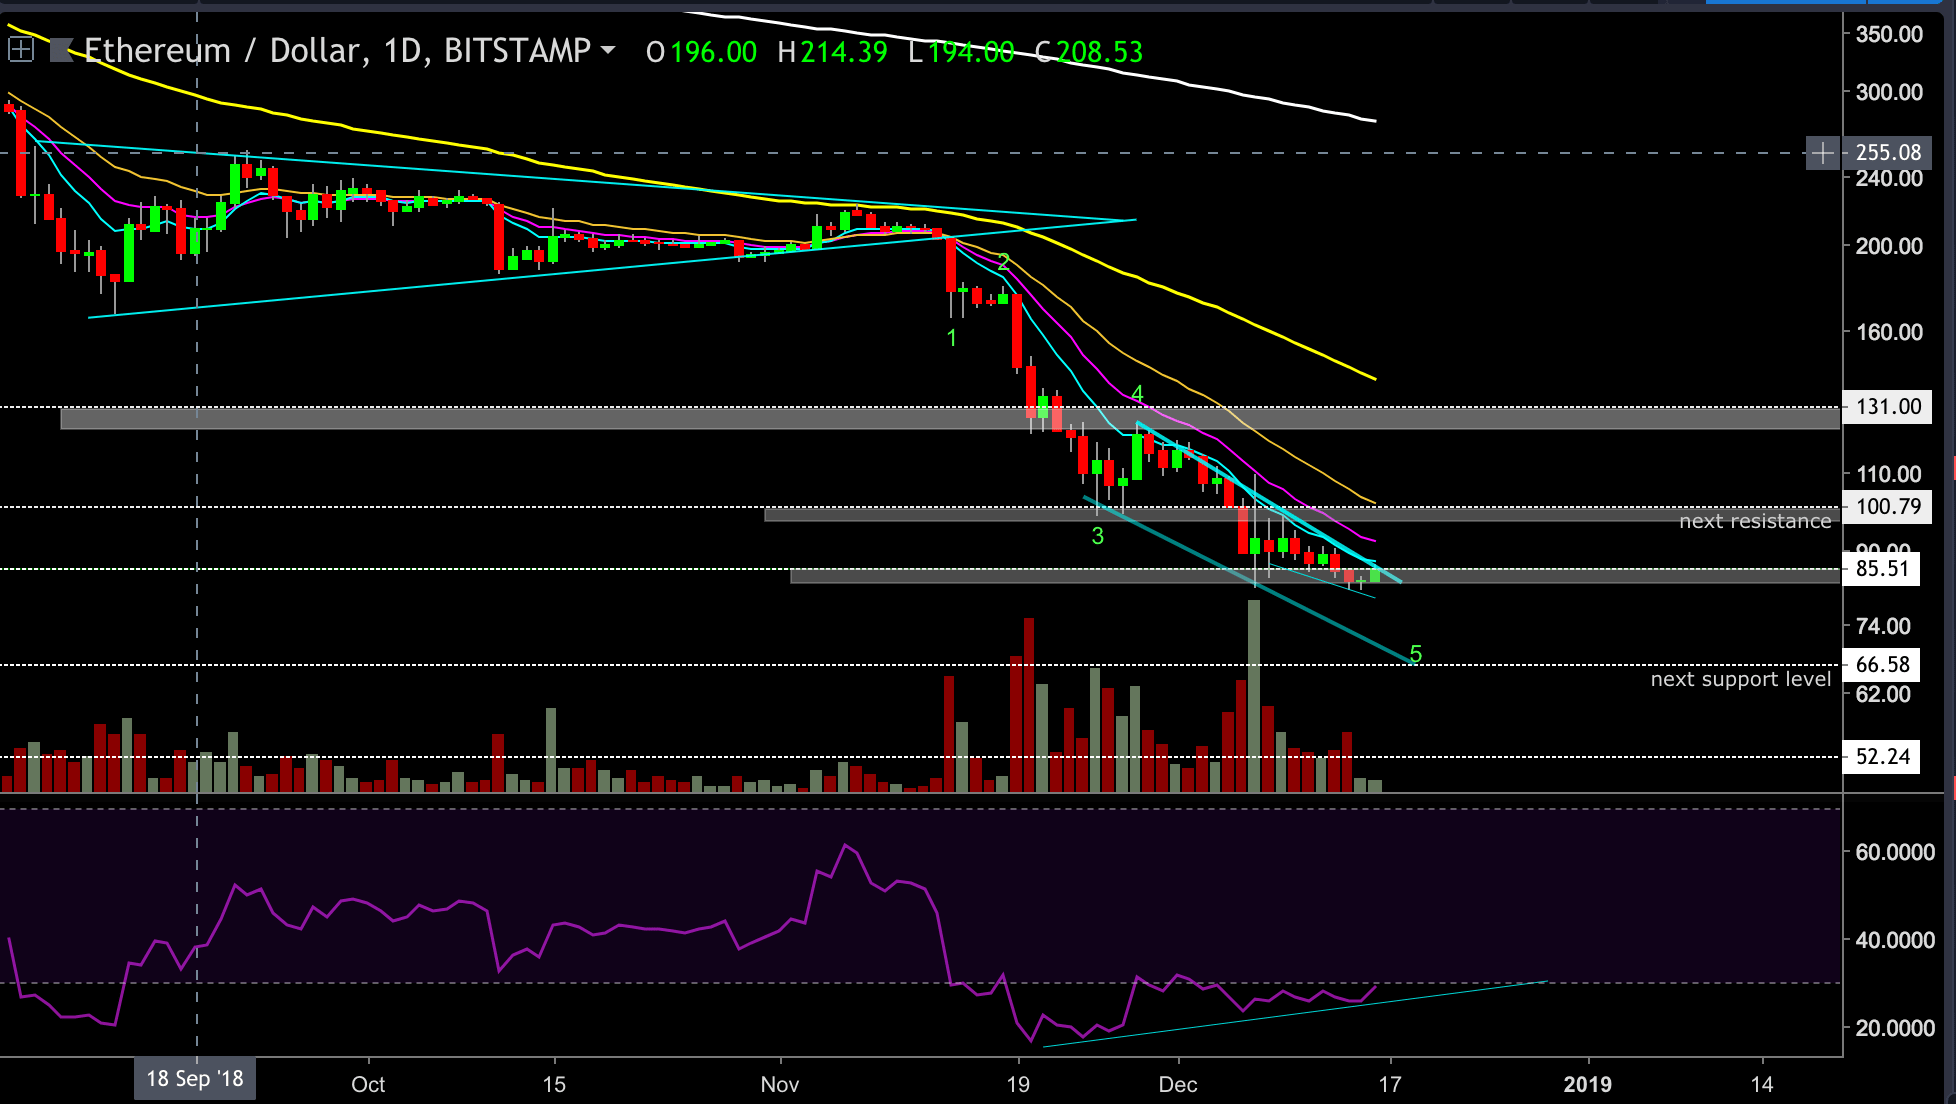
- My Elliott count is marked on the daily chart. According to this count, ETH has another leg down for wave 5 of 5 to touch the lower trend line, while the RSI is creating higher low at the same time.
- For the bulls: The best scenario I could wish for would be another move down as the 5th wave toward the next target at the $69 area, but, I would like to see the RSI creating another higher low at the same time. This could be the ultimate signal for my next long-term position – Completion of an Elliott count + RSI signal + daily support level holds.
ETH/USD BitStamp 4-Hour Chart
ETH/USD BitStamp 1-Day Chart
Cryptocurrency charts by TradingView. Technical analysis tools by Coinigy.
The post Ethereum Price Analysis Dec.16: Positive Diversions, Is Reversal Ahead? appeared first on CryptoPotato.