Ethereum Price Analysis Dec.10: Can The Bullish Momentum Take ETH Back Above $100?


The crypto market marked new annual lows during the past weekend. Bitcoin hit the $3200 price level, which is the lowest BTC price since October 2017, and Ethereum lost the $85 support to test an $80 price tag which was last seen during May 2017.
After hitting the above lows, we noticed a short squeeze maneuver taking place, With Bitcoin chart spiking 10%. This maneuver was very likely to take place, as we alerted in our last analysis about such possibility.
When the Bitcoin open short positions hit their all-time high level, it is typically a warning sign for a potential short squeeze attempt. And this is exactly what we saw yesterday for the second time: The Bitcoin shorts chart spiked up to 43,000 BTC (Bitfinex) before their squeeze back to the 37,000 BTC levels.
The spike in the price of Bitcoin started a mini-trend reversal, that is so-far holding, but this mini uptrend is looking more like a bear flag rather than a potential bottom.
The $3500-$3650 price level, which is currently acting as strong resistance, needs to be breached with high volume and to be tested once again as a support, in order to see a possible uptrend continuation.
Back to Ethereum
- ETH hit our previous analysis’ targets at the $84-$85.
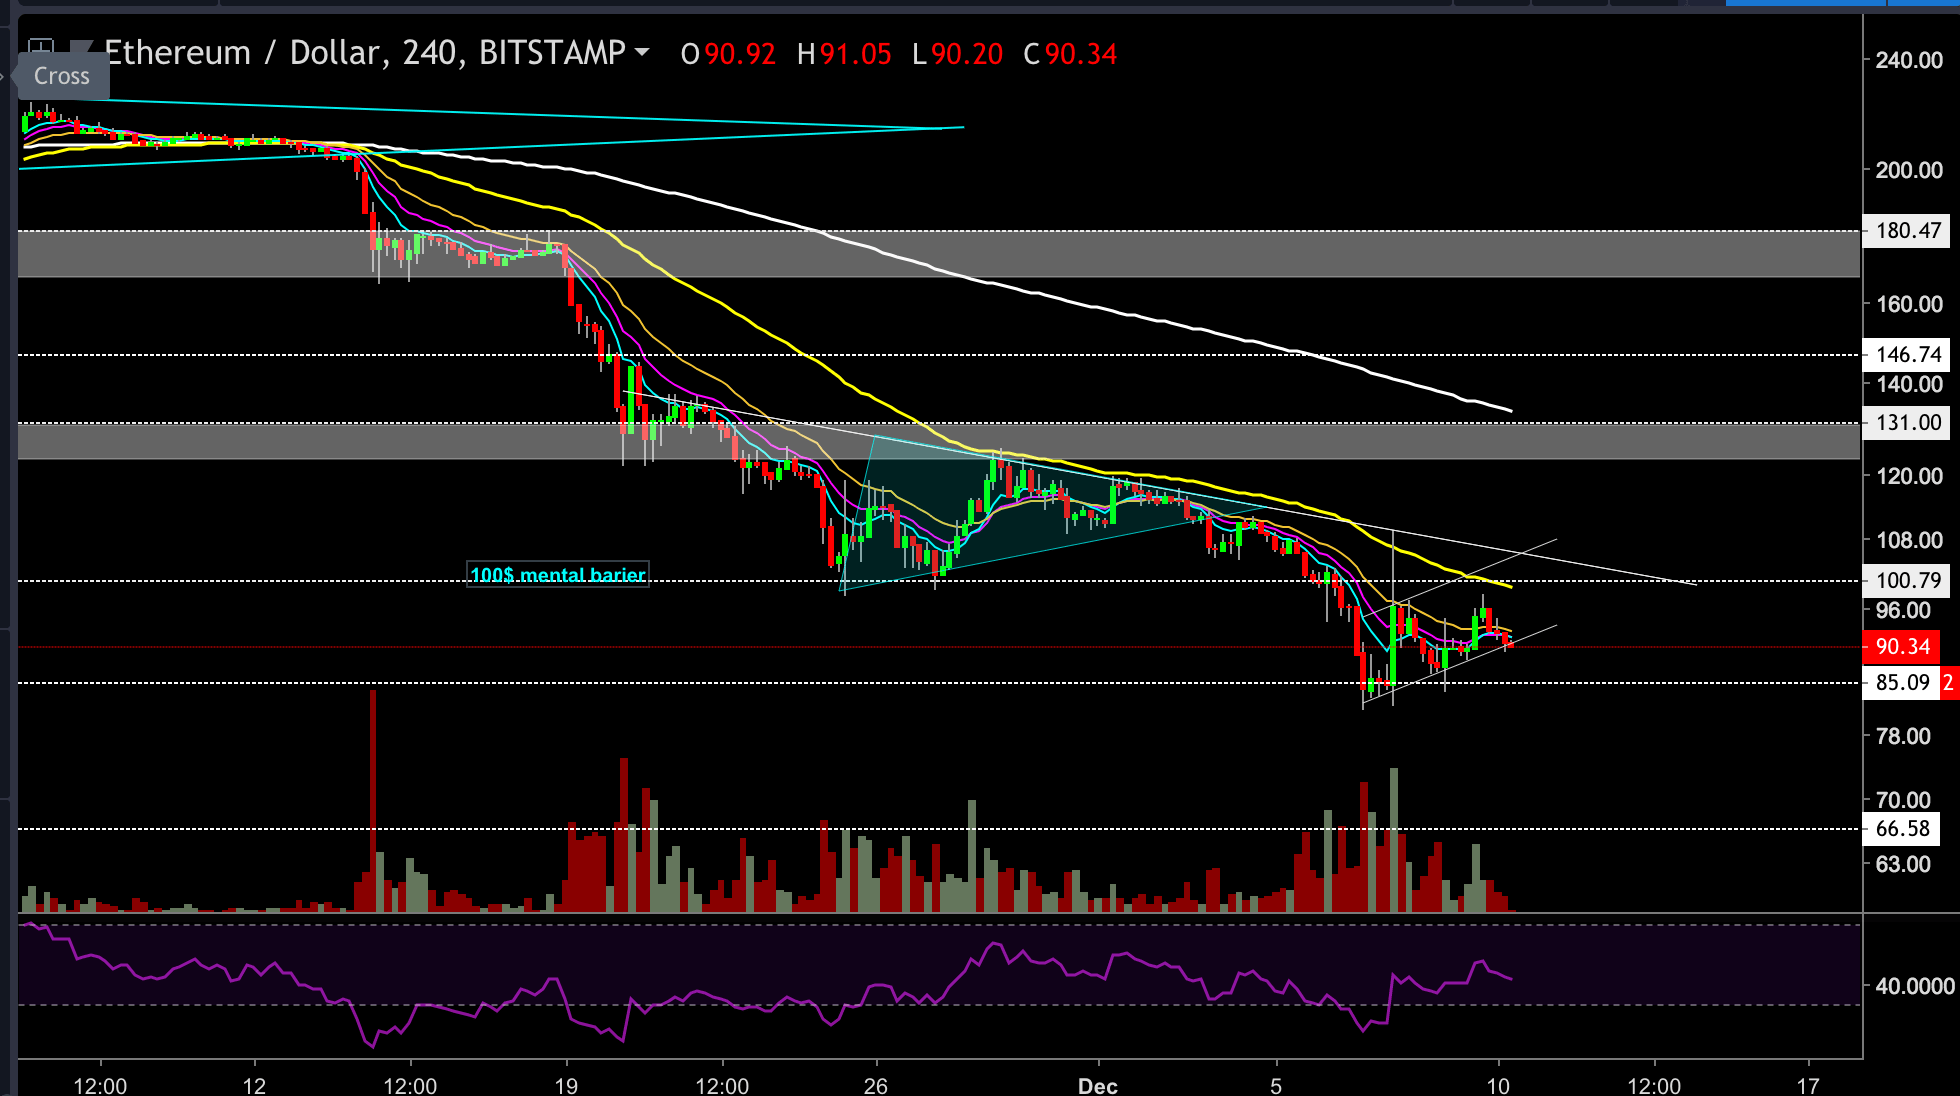
- Since then, the short squeeze had helped ETH to rally back to $110 for a little while. At the moment, the ETH chart is consolidating sideways around the $90 price levels.
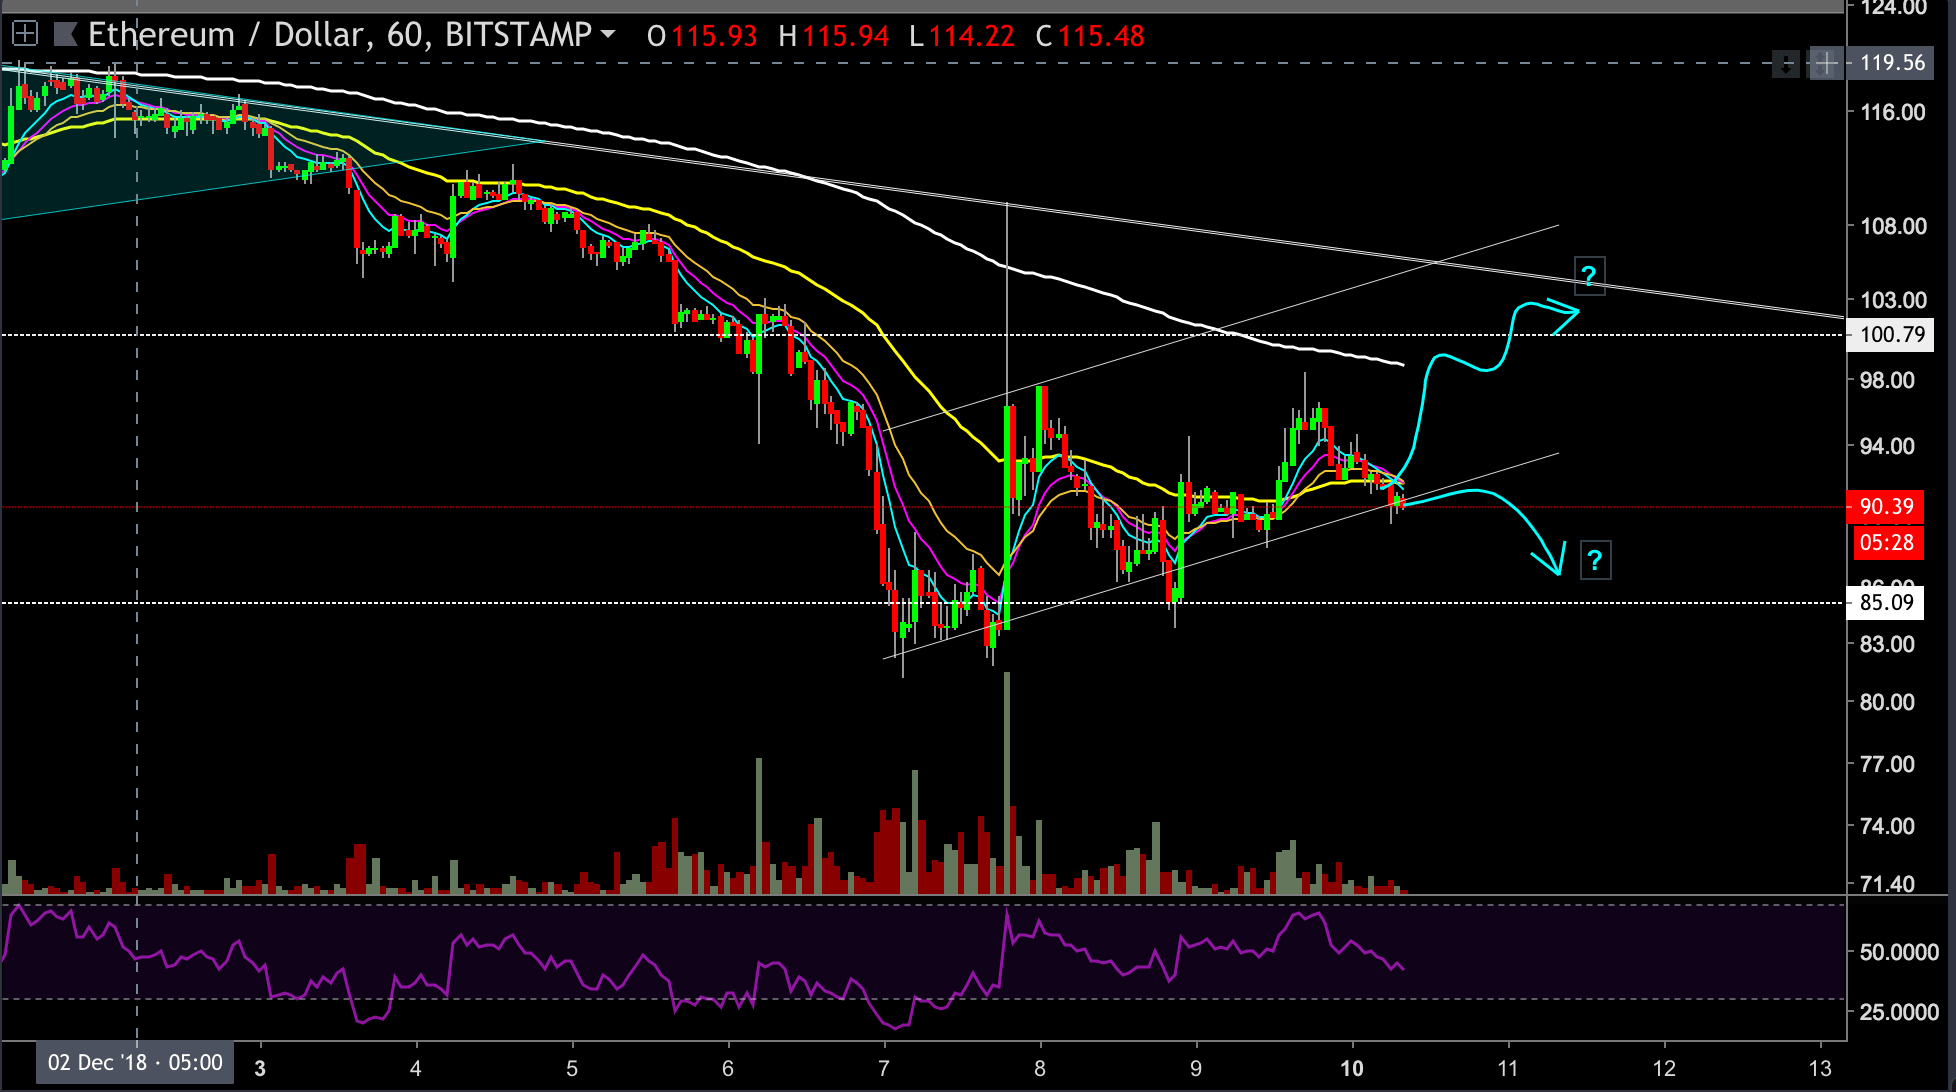
- If the bulls manage to continue the uptrend and price breaks above the upper channel’s trend-line at $110, then ETH could try for the next resistance level at the $122-$126 price area. However, it wouldn’t be easy. ETH will have to gain extra strength to successfully overcome the resistance along the way, including the $100 mental resistance level.
- On the other hand, if the ETH price breaches below the channel’s lower trend-line, then ETH will likely try the $80s regions one more time. If the above breaks down, then $69 and $50 are the next potential targets for the coin.
- At the moment on the 1-hour chart, ETH is struggling to stay above the channel’s support level around the $90’s price range. The outcomes of this will determine the next short-term direction for ETH.
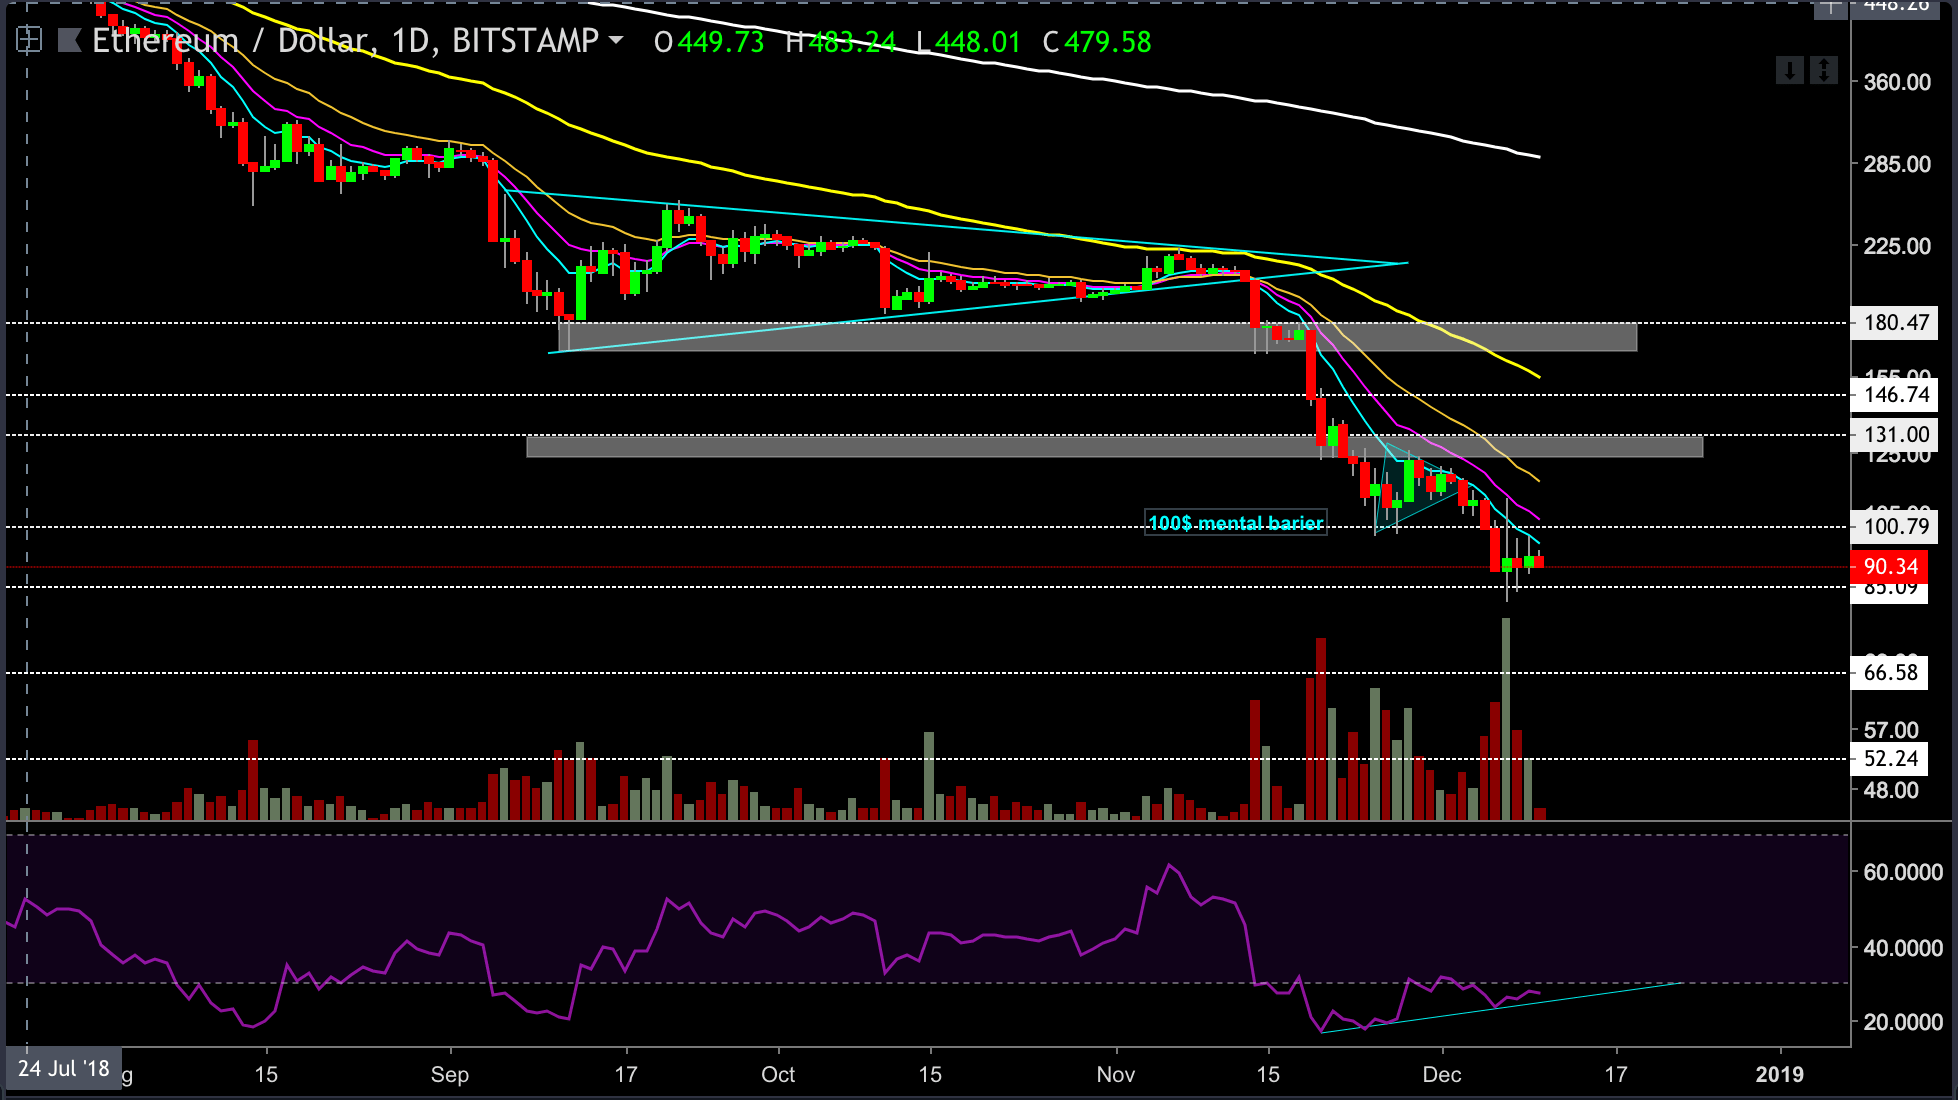
- On the daily chart, we can notice yesterday’s long Doji candle following decent green trading volume. This is a bullish sign; yet, we want to see that this candle’s low doesn’t break down for the next few days before the bulls can start smiling.
- The daily chart’s RSI is currently creating a positive diversion.
ETH/USD BitStamp 1-Hour Chart
ETH/USD BitStamp 4-Hour Chart
ETH/USD BitStamp 1-Day Chart
Cryptocurrency charts by TradingView. Technical analysis tools by Coinigy.
The post Ethereum Price Analysis Dec.10: Can The Bullish Momentum Take ETH Back Above $100? appeared first on CryptoPotato.