Bitcoin Price Analysis Nov.30: BTC Facing Down Again After RSI’s Turnaround


Is BTC facing down again? Yesterday we mentioned two signs that have worried us. Here they are:
“The hourly chart is forming a wedge. Breaking it to either direction will likely to create a significant move towards the breakout’s direction.
The daily chart’s RSI indicator is now testing support turned long-term resistance line. Unless breaking it, this could affect the current BTC festival, either today or tomorrow.”
So, the wedge was breached to the downside, along with the daily RSI that couldn’t get over the long-term resistance line.
After yesterday’s high at $4400 (Bitstamp), which turned out to be a 26% two-day correction, Bitcoin dropped 11% as of writing this.
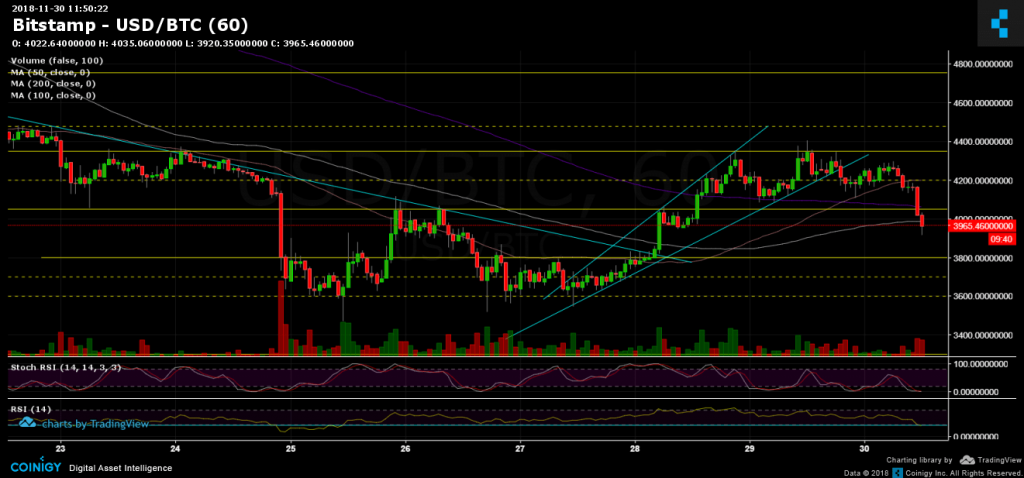
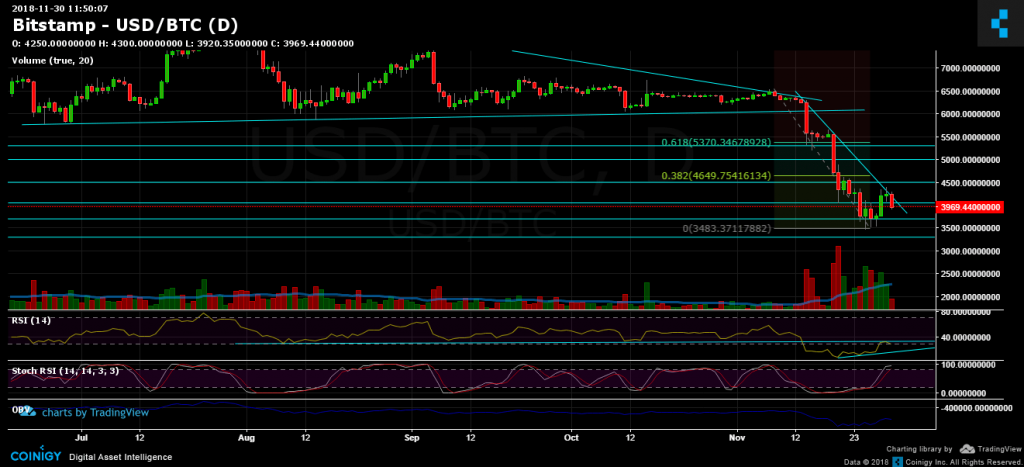
Looking at the 1-day & 1-hour charts
- The hourly chart’s Stochastic RSI is about to cross at the oversold area. This might indicate a possible correction up to re-test the $4050 area before continuing down.
- However, the Stochastic RSI of the daily is at its overbought zone and is about to cross down. This might indicate on the middle term. In other words, we hadn’t seen the bottom yet.
- Still looking in the 1-day chart: Bitcoin had encountered a significant descending trend-line (marked on the chart) and couldn’t breach over it.
- From the bear side, support at $4050 didn’t hold. The next levels lie at $3950, $3800 and $3700, before getting to the yearly low’s area at $3500.
- From the bull side, support turned resistance levels lie at $4050, $4355, $4500.
- By looking at the bigger picture, I would want to see Bitcoin breaches the $4700 and the $5400 areas, which are Fib retracement levels of the significant decline ($6500 down to $3500). Till then I would consider the market as bearish.
- The trading volume is still in favor of the sellers. It will be interesting to see the price action during the weekend.
- BitFinex’s open short positions have slightly decreased to 33.7K.
BTC/USD BitStamp 1-Hour chart
BTC/USD BitStamp 1-Day chart
Cryptocurrency charts by TradingView. Technical analysis tools by Coinigy.
The post Bitcoin Price Analysis Nov.30: BTC Facing Down Again After RSI’s Turnaround appeared first on CryptoPotato.