Bitcoin Price Analysis Nov.29: The Correction Continues But Keep Your Eye on the RSI


After breaking up the $4K area, Bitcoin had soared to a current high of $4355 (Bitstamp). This marks a correction of 25% from the yearly low that was seen just two days ago. As mentioned before – a violent move to one side carries violence to the other side. This is exactly what we see now.
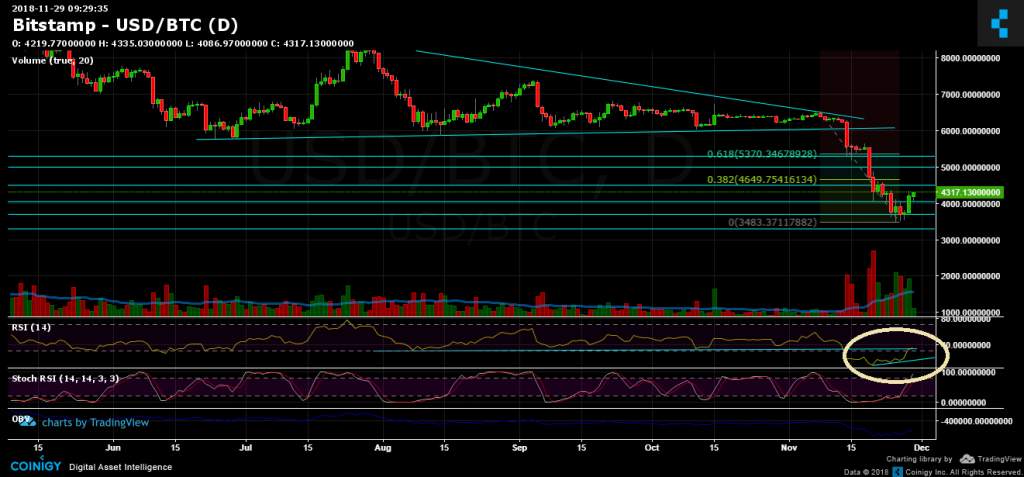
Is the bear market over yet? Are the bulls back? It’s too early to say. By looking at the bigger picture, I would want to see Bitcoin breaches the $4700 and the $5400 areas, which are Fib retracement levels of the significant decline ($6500 down to $3500).
Looking at the 1-day & 1-hour charts
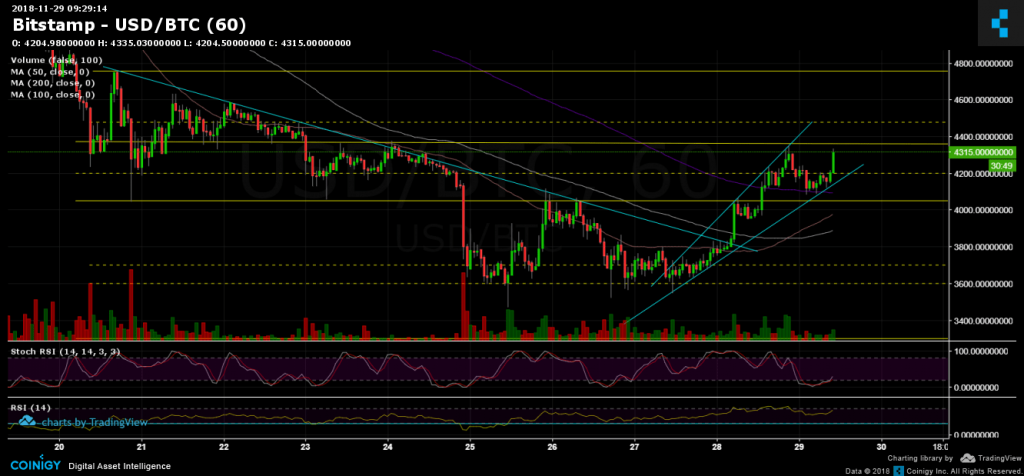
- From the bull side, the next resistance levels lie at $4355, $4500 and $4700.
- From the bear side, support levels lie at $4070, $3950 and $3700, along with the ascending trend-line.
- The hourly chart is forming a wedge. Breaking it to either direction will likely to create a significant move towards the breakout’s direction.
- The daily chart’s RSI indicator is now testing support turned long-term resistance line. Unless breaking it, this could affect the current BTC festival, either today or tomorrow. However, the bullish option is the formation of a bullish triangle in the daily chart’s RSI.
- The volume is decent in green (buyers are back). However, I am still waiting for even taller green candles to start thinking on a possible end to the bear market.
- BitFinex’s open short positions have increased to 35K, rising sharply as Bitcoin goes up.
BTC/USD BitStamp 1-Hour chart
BTC/USD BitStamp 1-Day chart
Cryptocurrency charts by TradingView. Technical analysis tools by Coinigy.
The post Bitcoin Price Analysis Nov.29: The Correction Continues But Keep Your Eye on the RSI appeared first on CryptoPotato.