Bitcoin Price Analysis Dec.30: Weekend BTC Sideways Action


Following yesterday’s BTC price analysis, we saw Bitcoin correcting down marking a daily low around the $3700 support line. From there, Bitcoin had returned to the $3800 area, where it’s trading as of writing this.
We talked about such option of a correction which was necessary since the 4-hour chart Stochastic RSI oscillator had crossed over on the overbought area.
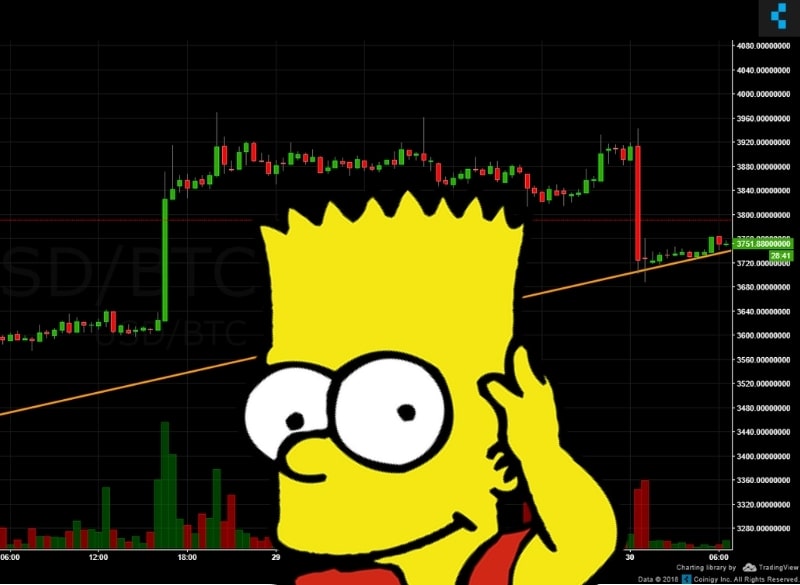
As can be seen on the following 30-min chart, Bitcoin made another Bart formation:
As long as Bitcoin won’t go below the $3500 support area, the possibility for an inverse head and shoulders pattern is still alive: in the case of breaking up the neckline around $4200, we could expect targets around the $5000 area.
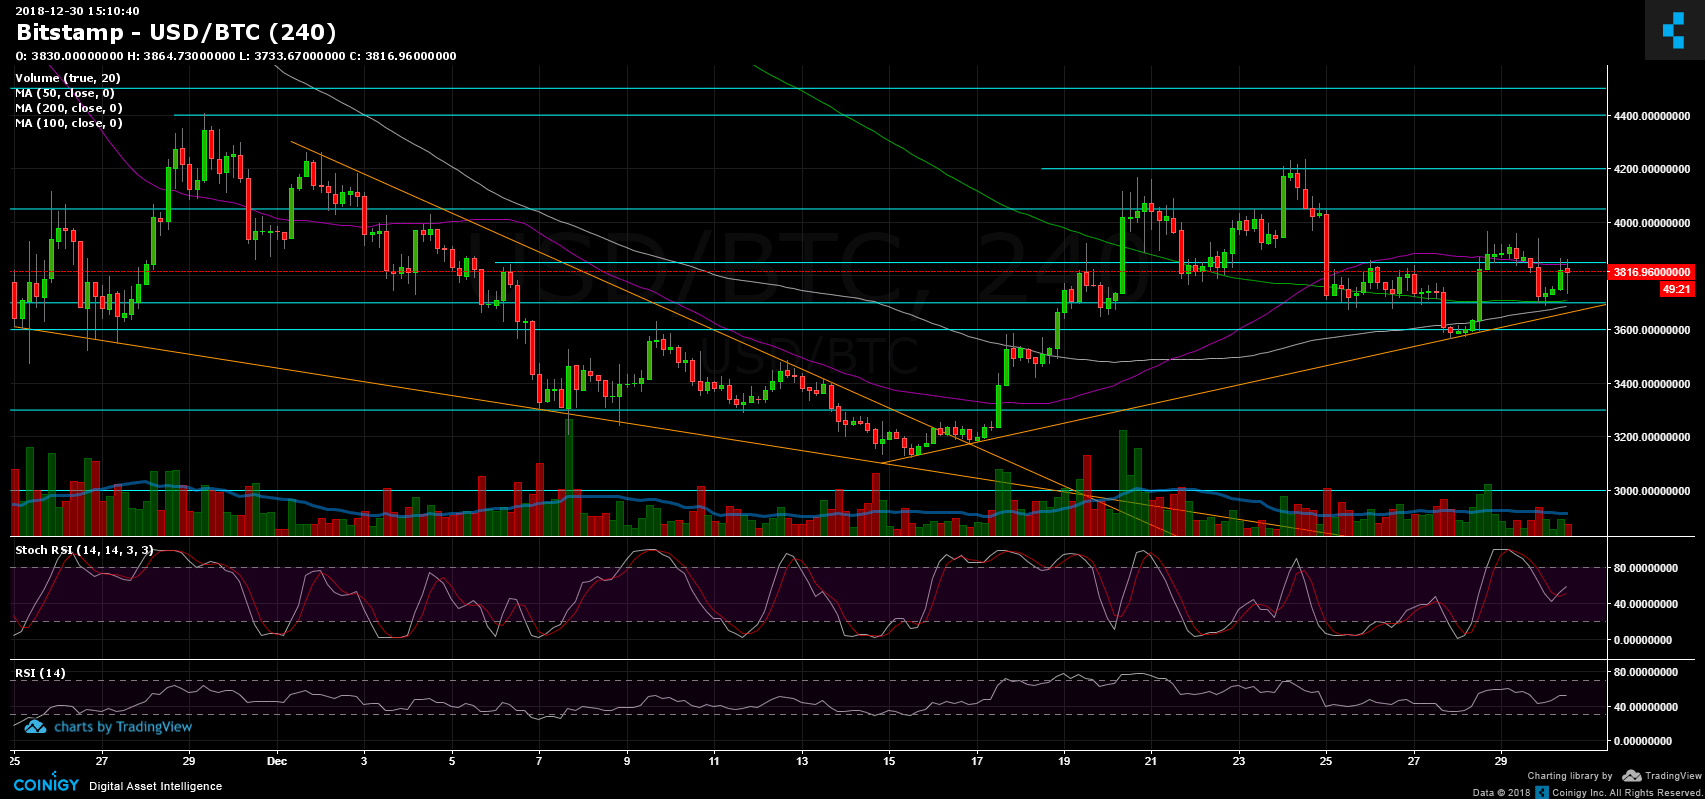
Looking at the 1-day & 4-hour charts
- Following the correction down, Bitcoin found support at the $3700 level, along with the 4-hour chart’s 200 and 100 moving average lines (marked light green and white on the following chart). MA-100 is about to cross over MA-200 which could turn out to be a bullish signal for the mid-term future.
- From the bear side, support in range lies at $3800, $3700 (strong support along with the ascending trend-line), $3600 and $3480.
- From the bull side, resistance levels lie around $3900, $3950, $4050, $4200.
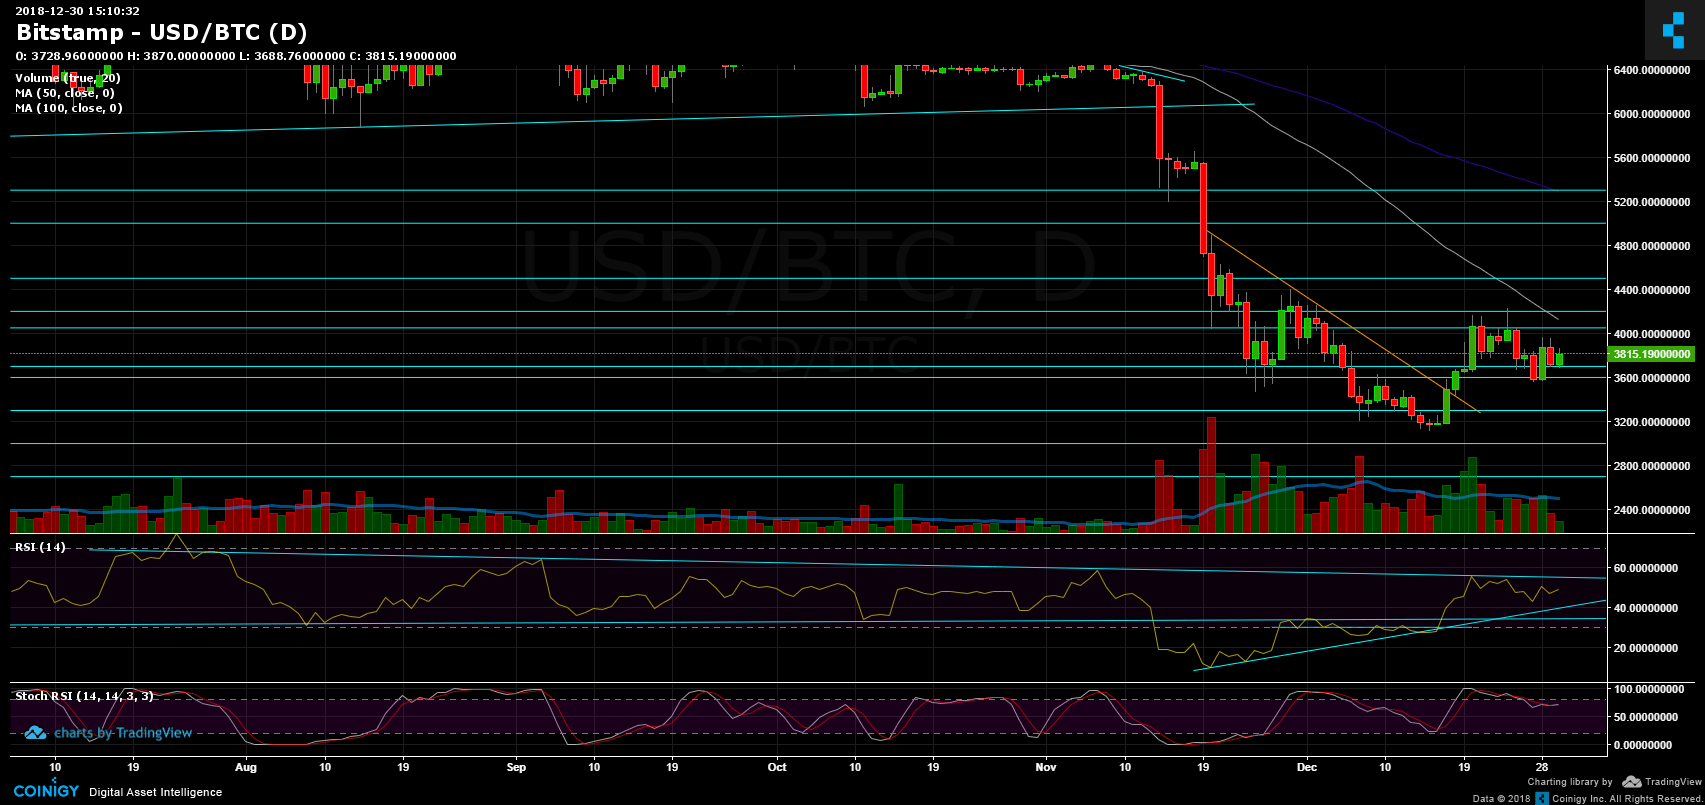
- The trading volume is still low. This is likely because of the weekend along with the holidays.
- BitFinex’s open short positions had increased to 33.2K BTC, not a significant change.
BTC/USD BitStamp 4-Hour chart
BTC/USD BitStamp 1-Day chart
The post Bitcoin Price Analysis Dec.30: Weekend BTC Sideways Action appeared first on CryptoPotato.