Bitcoin Price Analysis Dec.22: Is It Just a Healthy Correction, Or Back Down?


Since our previous BTC price analysis and as anticipated, Bitcoin had trouble breaking up the $4050 – $4100 resistance area.
Failing to break had led to a regression or correction and Bitcoin collapsed almost $400 to a daily low of $3770 (Bitstamp).
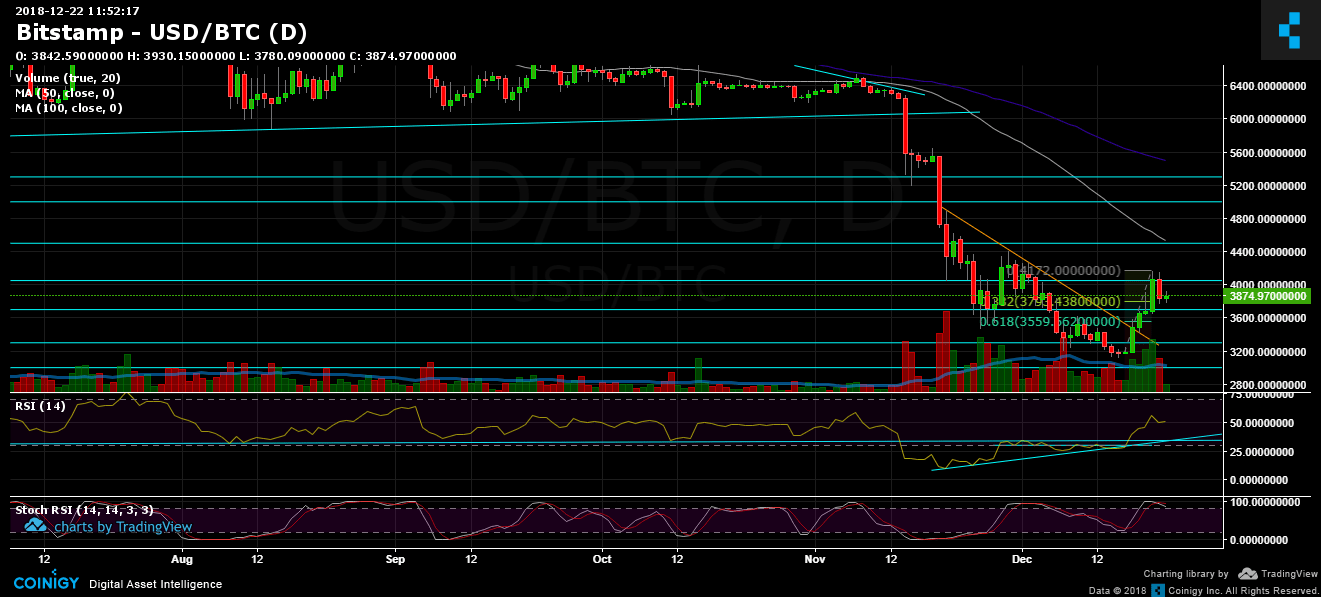
So far, this looks like a healthy correction following the 30% gain in three days. The correction had reached the 38.2% Fibonacci retracement level (marked on the attached daily chart) – around ~$3800.
Another reason for the correction might be the collapsing global markets. This December is so far the worst December since 1931. Wall Street fell 6-8% percent over the past week, following an interest rise.
Looking at the 1-day & 4-hour charts
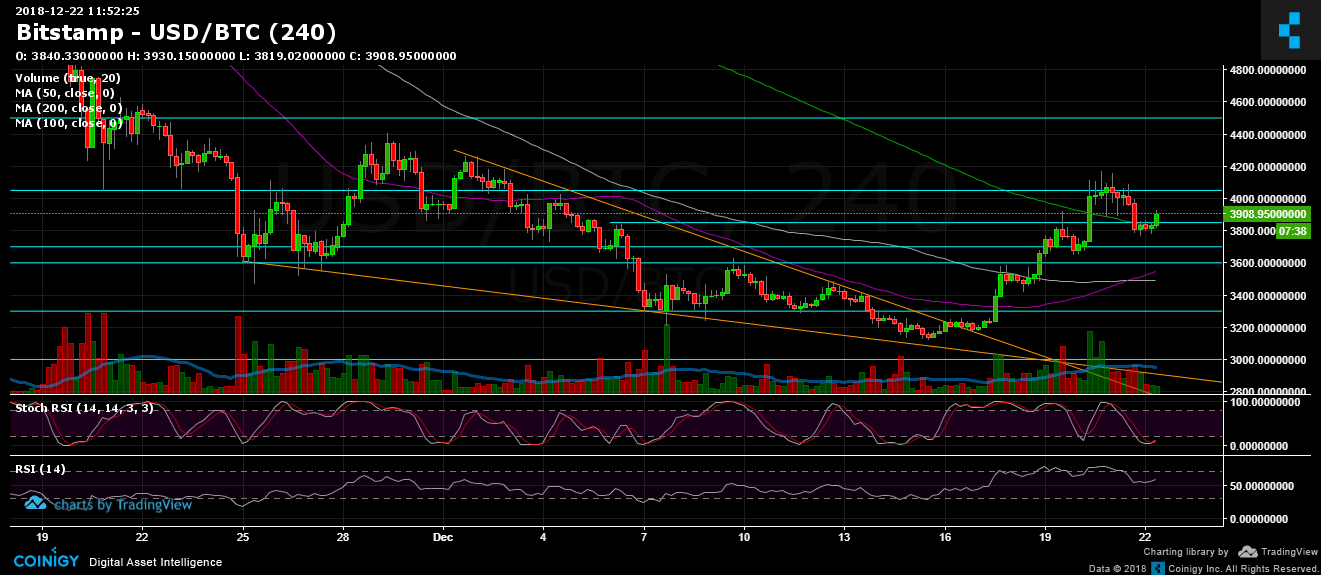
- Looking on the 4-hour chart, Bitcoin got supported on the 200 days moving average line (marked with light green). This MA line is critical, along with the $3850 support level.
- The correction is so far healthy. However, the daily chart’s Stochastic RSI oscillator has crossed over at the overbought level. This could trigger a deeper correction in the coming days.
- For the shorter-term, we might see Bitcoin getting closer to the $4000 again, as the 4-hour chart’s Stochastic RSI is about to cross over on the oversold area.
- The current area
- From the bear side, the support areas lie at $3770, $3700 and $3600.
- From the bull side, resistance lies at $4050 – $4100, $4200, and $4500 (along with the daily chart’s 50-days moving average line (white).
- The last level $4500, along with MA-50, is a key level for a possible change of the longer term bearish momentum.
- Trading volume: We see decent increasing volume green candles, while yesterday sellers’ candle was a shorter one. This is the first rule for a market controlled by buyers. Let’s see how it continues from here.
- BitFinex’s open short positions had decreased sharply to 34.6K BTC. Remember; when shorts are at their ATH expect a short squeeze. When shorts are at the bottom, expect a long squeeze.
BTC/USD BitStamp 4-Hour chart
BTC/USD BitStamp 1-Day chart
Cryptocurrency charts by TradingView. Technical analysis tools by Coinigy.
The post Bitcoin Price Analysis Dec.22: Is It Just a Healthy Correction, Or Back Down? appeared first on CryptoPotato.