
Bitcoin Price Analysis: Bulls Draw the Line at $3,200


Bitcoin price ran hard this week and now appears to be taking a breather and consolidating…or receding to double bottom near $3,200.
Bitcoin Price: Market Overview
What a week! The stock market is closing in on the worst week in a decade. The American government is on the verge of a ‘shut down’ that could extend over the Christmas holidays, Brexit is still happening, Italy can’t manage their debt, and France has been under siege by ‘Yellow Jacket’ protesters for weeks.
Clearly, the world is in a tizzy.
Fortunately, things are looking up for in the world of crypto. Bakkt is on the verge of launching, Bitcoin and Ethereum reclaimed a swath of recently lost territory, and a handful of notable analysts are suddenly feeling quite bullish about crypto’s prospects for 2019.
4 HR Chart
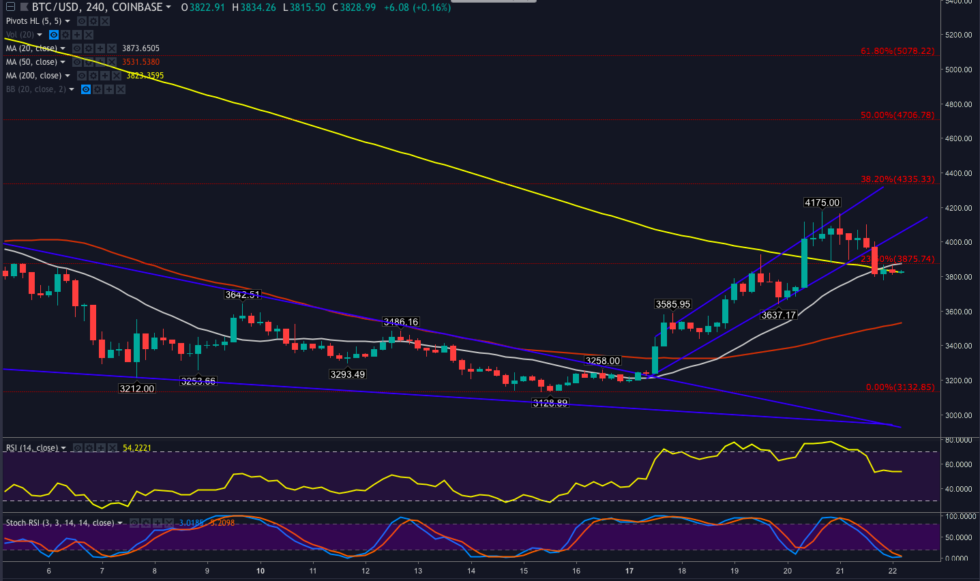
As mentioned above, after a decent 30% move this week, Bitcoin price 00 extended above the 200-MA and the 23.6% Fib retracement level to reach $4,172 twice. The current rally appears to have reached a point of exhaustion and bitcoin is pulling back from its high at $4,172.
The pattern of lower lows had been broken but the sharp upward move is still entirely indicative of a trend change as the current range is still far removed from where bitcoin was trading a month ago.
Weekly Chart
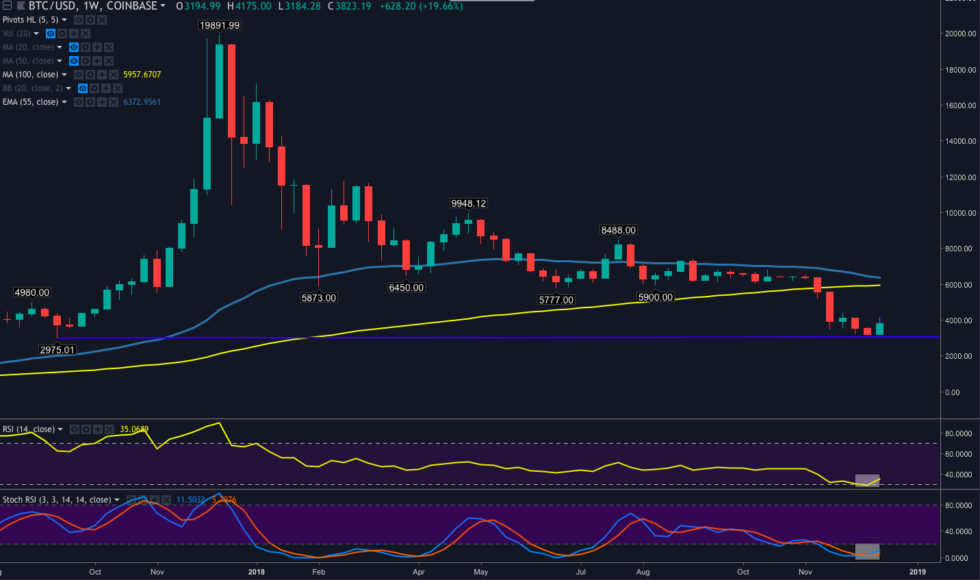
The weekly chart shows that the bearish downtrend is still in full effect. Early birds might keep watch for a daily higher low and higher high to follow through on the 4hr chart. Keeping a close eye on volume would be wise.
There is a bullish cross on the MACD, and the RSI has turned upward after being flatlined in oversold territory for some time, both oscillators are worth keeping an eye on as well.
Possible correction targets are near the 200-MA ($3,900), which is also aligned with the 23.6% Fib Retracement level and also at $3,700 – $3,600.
BTC price has slightly dropped below the 20MA and it appears that the coming days will bring a bit of consolidation. But the possibility of waning trading volume over the weekend and next week’s holiday could mean any drastic media announcements of market moves could easily cause Bitcoin to double bottom in the $3,100 – $3,200 zone.
BTC Shorts
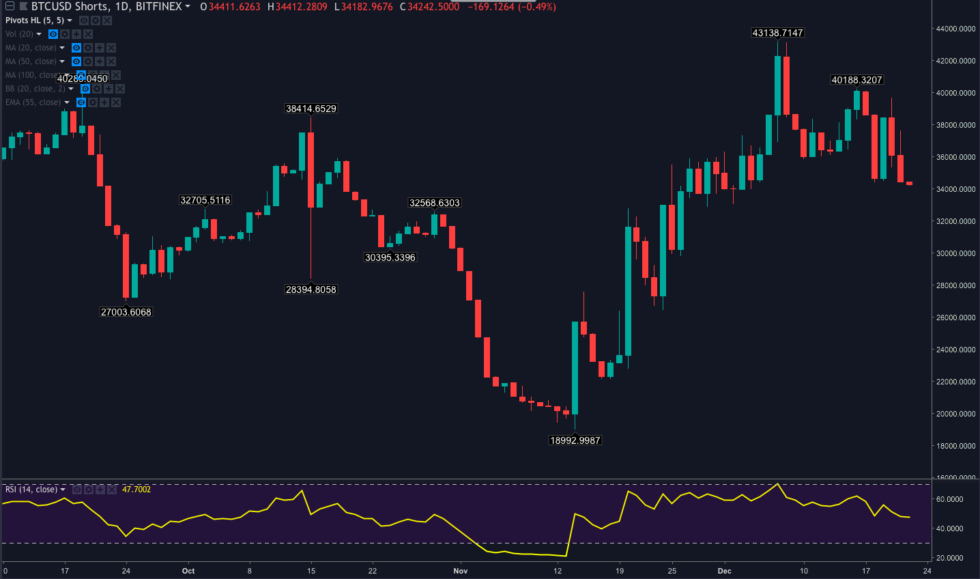
Open short positions on Bitfinex have dropped from the most recent all-time high and off the cuff observation is that each time BTC shorts near 40,000 there is a squeeze of varying degree.
Generally, bears remain confident and the high number of shorts supports this. As BTC pulls back and consolidates over the next 24-48 hrs, traders could keep an eye on BTC shorts to see if they slap back on at the more recent top $4,172.
If you made a quick buck during this quick rally – hats off to you. Lesser experienced and more conservative traders would be wise to wait for strong confirmation of a trend change before playing one’s’ hand at this volatile game.
[Disclaimer: The views expressed in this article are not intended as investment advice. Market data is provided by Coinbase and Bitfinex. The charts for analysis are provided by TradingView.]
Where do you think Bitcoin price will go over the weekend and holidays? Share your thoughts in the comments below!
Images courtesy of Shutterstock, Trading View. Market data sourced from Coinbase and Bitfinex.
The post Bitcoin Price Analysis: Bulls Draw the Line at $3,200 appeared first on Bitcoinist.com.