Ethereum Price Analysis Dec.2: ETH Is Seeking Direction


During last week, we noticed an upward correction in the price of Bitcoin and the major altcoins. This odd move developed into a symmetric triangle formation.
In case that the above triangle formation will break upward, it could send Bitcoin toward the $4600 – $4800 range. On the other hand, if the symmetrical triangle breaks down, then bitcoin will probably test the last lows around $3700.
There is also a possible Inverse Head and Shoulders pattern developing in progress (1-hour chart and above). If this formation plays out, then the market might have already found a short-term bottom.
Back to Ethereum
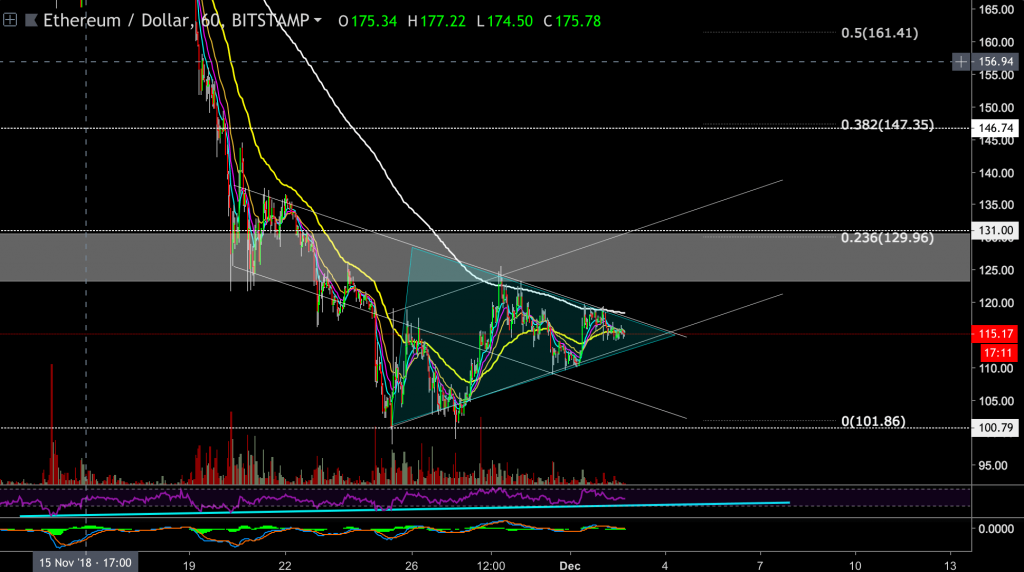
Ethereum’s chart follows Bitcoin’s chart as expected. The current sideways movement could be seen as a symmetrical triangle, as well as the inverted H&S formation.
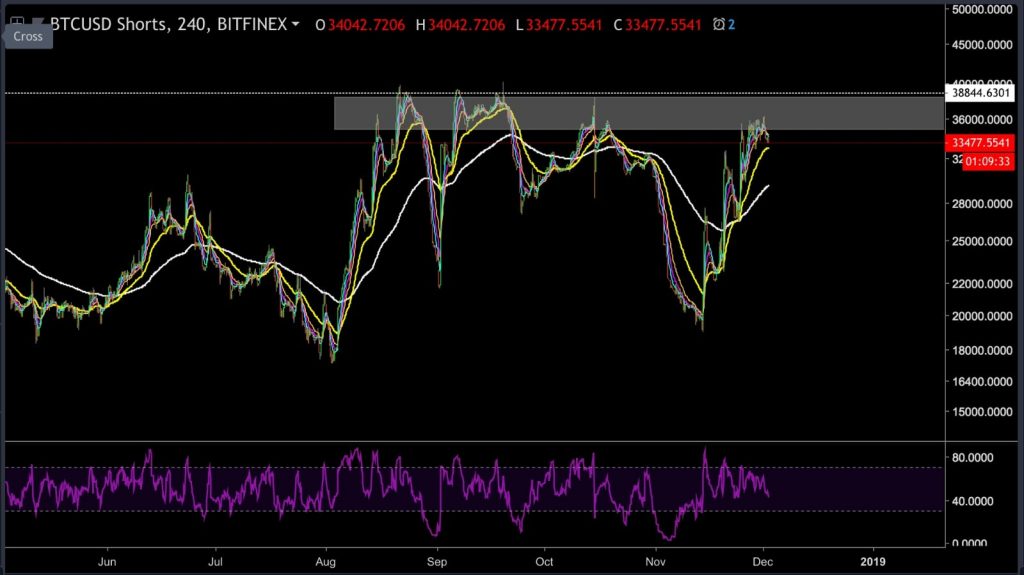
At the moment of writing this, the open short positions on Bitfinex are at the 34,000 area. If we look at the history of the last few months, this level of 35,000 – 40,000 was a typical level for short squeeze maneuvers.
In a scenario that a short squeeze will happen again, then the Bitcoin price should spike upwards. This move could reach the above targets or even higher.
Just as a reminder, a short squeeze refers to a situation when a price is being pushed upward intentionally to trigger the bear’s short positions stop-losses orders. To close those short orders, the bears need to buy back the asset which creates a rolling event that spikes the price.
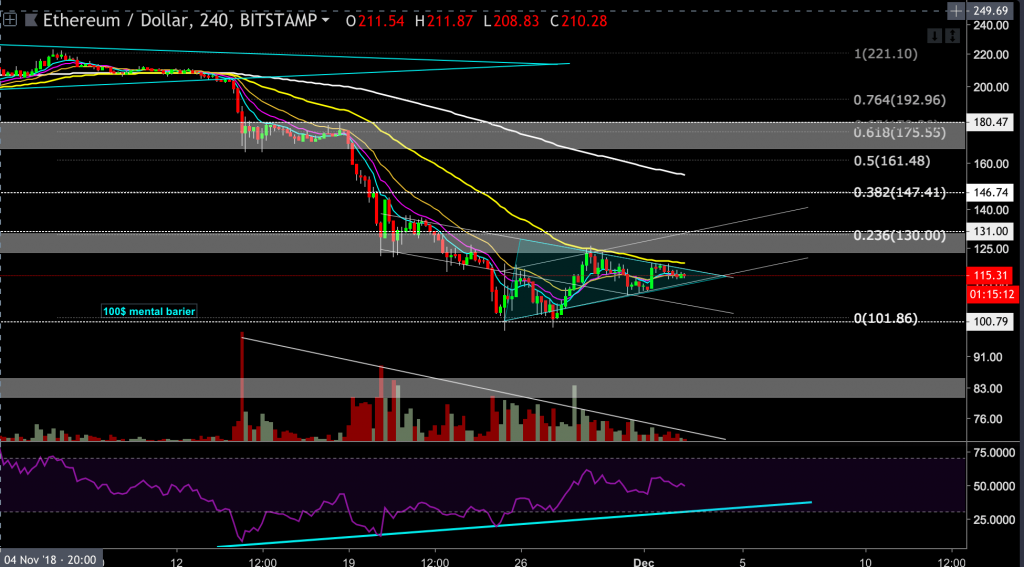
Looking at the ETH 4 hours chart
- Ethereum is currently trading at the $115 price level and is consolidating below the $122-$130 resistance level.
- If this triangle type of consolidation breaks upward and manages to climb above the $122-$130 resistance level, then ETH could attempt to reach the 0.382 Fibonacci retracement level at the $146 price level.
- To achieve that, ETH will need a lot of buyers’ volume and momentum, a momentum that is currently lacking in the market.
- On the other hand, if the bears take back the control and the triangle formation breaks to the downside, then the $100 price level is probably the first stop on the short term.
- The RSI indicator is still creating higher lows and is currently out of the oversold range.
Remember: these types of symmetrical consolidation formations can easily break to either side of the equation. So traders should be patient, protect their funds and always use stop-loss commands.
ETH/USD BitStamp 1-Hour Chart
ETH/USD BitStamp 4-Hour Chart
BTC/USD BitFinex Shorts
Cryptocurrency charts by TradingView. Technical analysis tools by Coinigy.
The post Ethereum Price Analysis Dec.2: ETH Is Seeking Direction appeared first on CryptoPotato.